01. Historical Context
AXA through 2035: what a realistic long-range model looks like
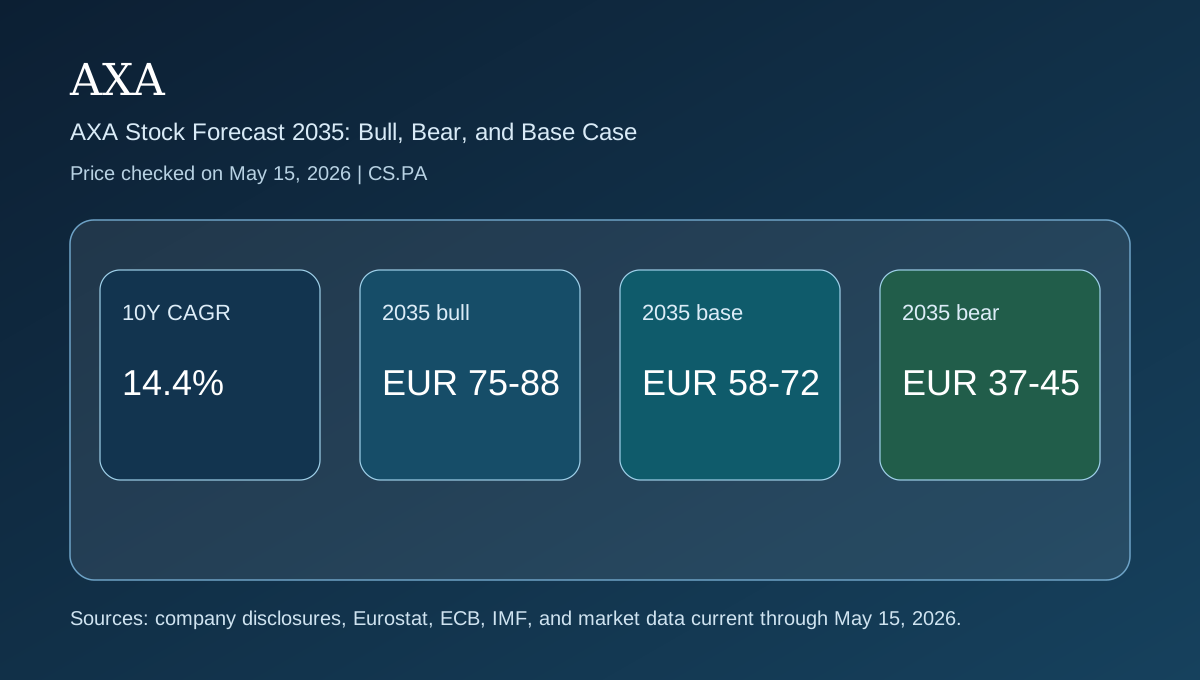
AXA has already delivered a strong decade for shareholders: the 10-year adjusted price CAGR is about 14.4%, and the stock is still trading not far below its 10-year high of EUR 42.68.
That matters because a long-range forecast needs to separate what the market has already rewarded from what still has to be earned. The next ten years are unlikely to be a repeat of the last ten unless operating performance stays exceptional and the market keeps paying for it.
For a 2035 framework, dividends, buybacks, capital intensity, and solvency discipline matter as much as pure top-line growth.
| Horizon | Latest anchor | Current assessment |
|---|---|---|
| 10-year lookback | Monthly close range from EUR 13.8 to EUR 42.68; adjusted CAGR about 14.4% | Strong prior decade |
| 2027 plan anchors | 2024-2026 plan targets underlying EPS CAGR of 6-8%, underlying RoE of 14-16%, and cumulative organic cash upstream above EUR 21 billion | Key medium-term checkpoint |
| 2035 valuation | Long-run case depends on whether cash returns remain high without a valuation reset | Compounding, not hype |
02. Key Forces
Five long-duration drivers behind the 2035 case
AXA's first support is operating momentum. AXA reported 1Q26 gross written premiums and other revenues of EUR 38.0 billion and kept its 2026 EPS view at the upper end of the 6-8% target range.
The second support is capital return. AXA still carries a strong solvency buffer at 211% and couples that with EUR 1.25 billion annual buyback plus a 75% total payout policy. That matters because, at the current multiple, buybacks and dividends remain an important part of total return.
The third support is valuation discipline. A stock trading at 11.54x trailing earnings and 9.59x forward earnings does not look like a momentum bubble, but it also no longer offers the margin of safety of a deeply unloved insurer.
The fourth force is macro transmission. Higher bond yields can support investment income, but sticky inflation can also feed claims costs and keep equity multiples contained. The latest IMF, Eurostat, and ECB data point to slower but still positive growth rather than a clean reacceleration.
The fifth force is strategic execution. For insurers, the stock usually follows the combination of pricing discipline, claims control, capital management, and distribution reach. The market eventually looks through slogans and asks whether those four levers are still working.
| Factor | Latest data | Current Assessment | Bias |
|---|---|---|---|
| Valuation | Trailing P/E 11.54x; forward P/E 9.59x | Reasonable for a large European insurer, not distressed | Neutral to Bullish |
| Operating momentum | FY25 underlying earnings at EUR 8.4 billion; 1Q26 revenues EUR 38.0 billion | Running ahead of a flat macro backdrop | Bullish |
| Underwriting quality | 1Q26 P&C premiums +4%; pricing still favorable | Still disciplined, but must hold through the next catastrophe cycle | Bullish |
| Capital strength | Solvency II 211%; EUR 1.25 billion annual buyback plus a 75% total payout policy | A strong capital base still supports dividends and buybacks | Bullish |
| Macro drag | Euro area CPI 3.0% in April 2026; GDP +0.1% q/q in 1Q 2026 | Higher claims inflation is the main external risk | Neutral |
03. Countercase
What would stop the long-run compounding story
The countercase is not that the franchise is weak. It is that the next stage of upside may be capped if inflation, claims pressure, and multiple discipline all tighten at the same time.
That is why the current macro backdrop matters. The IMF now sees euro area growth at 1.1% in 2026, while the ECB still describes the outlook as highly uncertain after a 0.1% first-quarter GDP print.
If operating trends weaken while macro conditions stay noisy, the stock could deliver a much flatter path than a straight-line forecast assumes.
| Risk | Latest data | Break level | Current assessment |
|---|---|---|---|
| Claims inflation | Euro area CPI 3.0% in April 2026; energy 10.9% | If pricing no longer offsets claims inflation | Manageable, but rising |
| Capital buffer | Solvency II at 211% after 1Q26 | Below 205% | Still robust |
| Valuation reset | Shares trade at 11.54x trailing P/E | A de-rating to 9-10x | Possible in weaker markets |
| Plan delivery | underlying EPS growth at the upper end of the 6-8% target range | If FY26 slips below the 6-8% plan range | Key watchpoint |
04. Institutional Lens
Institutional lens: long-run anchors, not short-term noise
AXA's own disclosures set the nearest institutional anchor. The May 5, 2026 activity indicators showed 1Q26 revenues of EUR 38.0 billion, Solvency II of 211%, and a reaffirmed 2026 EPS-growth view at the upper end of the plan range.
The macro anchor is less comfortable. The IMF cut its 2026 euro area growth view to 1.1% in April 2026, while Eurostat and the ECB both showed inflation pressure picking up again into April.
That leaves current market data as the valuation anchor. At EUR 39.18 and 11.54x trailing P/E, investors are paying for resilience, but not yet for an extreme growth story.
| Source | Updated | What it says | Why it matters |
|---|---|---|---|
| AXA | May 2026 | AXA reported EUR 38.0 billion of 1Q26 revenues and kept 2026 EPS growth at the upper end of its target range | Company execution still drives the thesis |
| IMF Europe | April 17, 2026 | The IMF cut its 2026 euro area growth view to 1.1% as energy shock risk rose | Supports a cautious growth backdrop |
| Eurostat | April 30, 2026 | Euro area inflation was 3.0% in April 2026; energy inflation was 10.9% | Claims costs and discount rates remain live issues |
| ECB | Issue 3, 2026 | The ECB noted euro area GDP growth of 0.1% in 1Q 2026 and kept the deposit rate at 2.00% | No hard landing yet, but no easy macro tailwind either |
| Market data | May 15, 2026 | EUR 39.18 share price with 11.54x trailing P/E and 9.59x forward P/E | Valuation is no longer a deep-value story |
05. Scenarios
Bull, base, and bear ranges to 2035
Long-range forecasts should be treated as ranges, not as promises. The base case assumes that earnings and capital return continue to do most of the work, while the exit multiple stays broadly around the current area.
The bull case requires sustained operating discipline for most of the next decade. The bear case does not require a franchise break; it only requires that growth slows and the market decides to pay less for it.
| Scenario | Probability | Trigger | Target range | Review point | Action bias |
|---|---|---|---|---|---|
| Bull | 25% | AXA delivers 2026 underlying EPS growth at the upper end of 6-8%, solvency holds above 210%, and pricing remains favorable | EUR 75-88 | Review after FY26 and FY27 results | Add only if the trigger is visible |
| Base | 50% | Revenue growth remains positive, the 75% payout policy stays intact, and the stock holds around 10-11.5x earnings | EUR 58-72 | Review at each half-year report | Core holding or watchlist |
| Bear | 25% | Plan delivery slips, solvency drops below 205%, or claims inflation forces a lower multiple | EUR 37-45 | Reassess immediately if the trigger appears | Reduce or stay patient |
References
Sources
- AXA 1Q26 activity indicators
- AXA full year 2025 earnings
- AXA 2024-2026 strategic plan
- Yahoo Finance 10-year chart data for CS.PA
- Stock Analysis overview for AXA SA
- Stock Analysis statistics for AXA SA
- IMF Regional Economic Outlook for Europe, April 2026
- Eurostat flash estimate for euro area inflation, April 2026
- ECB Economic Bulletin Issue 3, 2026