01. Current Data
The current operating and valuation picture
| Metric | Latest figure | Why it matters |
|---|---|---|
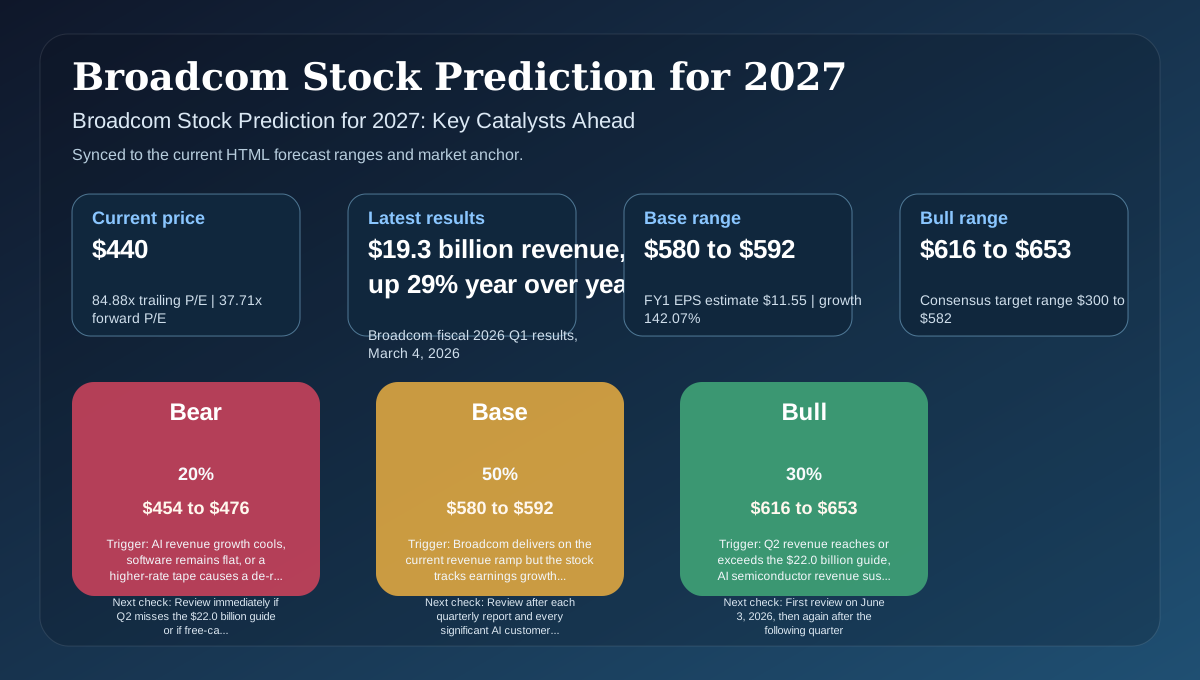
| Share price | $440 | Sets the market starting point for every scenario |
| Valuation | 84.88x trailing P/E; 37.71x forward P/E | Defines whether the stock still has room for multiple expansion |
| Latest results | $19.3 billion revenue, up 29% year over year | Broadcom fiscal 2026 Q1 results, March 4, 2026 |
| EPS setup | TTM EPS $5.13; next-year consensus EPS $11.55 | Shows the bridge between current earnings and forward expectations |
| Consensus range | $456 average target; $300 low; $582 high | Frames how much upside the Street still sees from here |
| Capital allocation / guide | $22.0 billion Q2 FY2026 revenue guide with 68% adjusted EBITDA | Creates the next measurable checkpoints for the thesis |
Broadcom's base case stays positive because the AI numbers are real, not because the valuation is easy. At $435.45, the stock trades on 84.88x trailing earnings and 37.71x forward earnings. That is a rich setup, but unlike many crowded stories, Broadcom is pairing it with genuine revenue acceleration and very high cash conversion.
The latest official filing was unusually strong. Broadcom reported fiscal 2026 first-quarter revenue of $19.311 billion, up 29% year over year, GAAP diluted EPS of $1.50, non-GAAP EPS of $2.05, and adjusted EBITDA of $13.128 billion, or 68% of revenue. Management said Q1 AI revenue reached $8.4 billion, up 106% year over year, above forecast, and guided Q2 revenue to roughly $22.0 billion with adjusted EBITDA again around 68% of revenue. Broadcom also said it expects Q2 AI semiconductor revenue of $10.7 billion and authorized a new $10 billion buyback.
The macro backdrop still matters because Broadcom is both a semiconductor and infrastructure software name. U.S. real GDP rose 2.0% annualized in Q1 2026, while real final sales to private domestic purchasers increased 2.5% and the gross domestic purchases price index rose 3.6%. April 2026 CPI rose 3.8% year over year and core CPI rose 2.8%; March 2026 PCE inflation was 3.5% year over year and core PCE was 3.2%. On April 1, 2026, the IMF projected U.S. GDP growth of 2.4% on a Q4/Q4 basis for 2026 and said core PCE inflation should move back to 2% in the first half of 2027. If growth stays positive and yields stabilize, the market can continue rewarding AI-linked cash-flow compounding. If inflation stays sticky, Broadcom's multiple and debt load become more visible constraints.
02. Key Factors
Five factors shaping the next move
The first force is valuation versus earnings speed. Broadcom's trailing P/E of 84.88x looks extreme, and its forward P/E of 37.71x still tells you the market expects a very steep earnings ramp. The second force is whether AI revenue keeps expanding fast enough to justify that bridge from trailing to forward numbers.
The third force is software durability. Semiconductor revenue is booming, but the quarter also showed infrastructure software revenue of $6.796 billion, essentially flat year over year. The fourth force is free-cash-flow quality, which is excellent at $8.010 billion in the quarter. The fifth is balance-sheet discipline: Broadcom still carries net debt, so execution has to remain good enough that leverage never becomes the center of the story.
| Factor | Why it matters | Current Assessment | Bias | Current evidence |
|---|---|---|---|---|
| Valuation | Shows how much future AI upside is already discounted | Rich but growth-backed | 0 | 84.88x trailing P/E falls to 37.71x forward only if the expected EPS ramp arrives |
| Recent earnings | Confirms whether the AI thesis is already visible in reported numbers | Very strong | + | $19.311 billion revenue, $13.128 billion adjusted EBITDA, and $8.4 billion AI revenue in Q1 |
| Estimate backdrop | Sets the market's hurdle for the next year | Strong | + | Consensus FY2026 EPS is $11.55 with an average target of $456 and a high target of $582 |
| Cash conversion | Separates real economic strength from accounting noise | Strong | + | $8.010 billion free cash flow in Q1, equal to 41% of revenue |
| Balance-sheet and rates | Determines how forgiving the stock can be if sentiment turns | Mixed | 0 | Net debt remains roughly $51.9 billion while CPI and core PCE are still above target |
03. Countercase
What could weaken the stock from here
The first downside argument is that Broadcom's valuation still leaves little room for a pause. A trailing P/E near 85x and a forward P/E near 38x can only be rationalized if the forward earnings ramp is delivered. If AI growth remains good but merely less explosive, the stock can stall even while fundamentals improve.
The second risk is concentration. Broadcom's Q1 AI revenue reached $8.4 billion and the company expects $10.7 billion in AI semiconductor revenue in Q2. That is powerful momentum, but it also means a handful of hyperscale and custom-silicon programs carry a lot of explanatory weight.
The third risk is mix quality and leverage. Infrastructure software revenue was only $6.796 billion, up 1% year over year, while Broadcom still has more than $66 billion of debt on the balance sheet. The debt is manageable with current cash generation, but it becomes a much bigger discussion if AI demand cools while rates stay elevated.
| Risk | Latest data point | Why it matters now | What would confirm it |
|---|---|---|---|
| Valuation reset | 84.88x trailing P/E; 37.71x forward P/E | The stock needs the forecast earnings ramp to arrive on schedule | Forward P/E stays high while FY2026 or FY2027 EPS estimates are cut |
| AI concentration | $8.4 billion Q1 AI revenue; $10.7 billion Q2 AI semiconductor expectation | A concentrated custom-AI customer base can create volatility around a few large programs | AI revenue growth slows materially below management's current pace |
| Software flatness | $6.796 billion infrastructure software revenue, up 1% year over year | Software was steady, not booming, so semis are doing most of the valuation work | Software remains flat while semis normalize |
| Leverage and rates | Net debt of about $51.88 billion; March core PCE 3.2% | The model works best when cash generation stays high and rates do not reprice sharply higher | Higher yields coincide with weaker cash conversion or softer guidance |
04. Institutional Lens
How current source material changes the thesis
Broadcom's official 8-K filed with the SEC on March 4, 2026 gave the most useful institutional signal. It showed $19.311 billion of Q1 revenue, $13.128 billion of adjusted EBITDA, $8.010 billion of free cash flow, Q1 AI revenue of $8.4 billion, and Q2 guidance for roughly $22.0 billion of revenue with 68% adjusted EBITDA.
Consensus remains constructive, but not euphoric. As of May 14, 2026, StockAnalysis showed 29 analysts on Broadcom with a Strong Buy consensus, an average target of $456, a low target of $300, and a high target of $582. That relatively tight average upside versus the current price tells you the Street likes the business more than it likes chasing the valuation.
The sector backdrop still helps. FactSet said on April 2, 2026 that total estimated S&P 500 Q1 earnings had increased 0.4% since December 31, with Information Technology showing the second-largest increase in expected dollar earnings at +8.0% and the highest count of positive EPS guidance at 33 companies. On April 1, 2026, the IMF projected U.S. GDP growth of 2.4% on a Q4/Q4 basis for 2026 and said core PCE inflation should move back to 2% in the first half of 2027. For Broadcom, that means the thesis remains strongest when AI spending keeps compounding inside a still-growing economy, not when investors are forced to pay a higher discount rate for the same future cash flows.
| Source type | Concrete datapoint | Why it matters for the stock |
|---|---|---|
| Broadcom SEC filing, March 4, 2026 | $19.311 billion revenue, $8.4 billion AI revenue, $8.010 billion free cash flow, $22.0 billion Q2 guide | Anchors the thesis in reported and guided numbers |
| StockAnalysis snapshot, May 14, 2026 | 84.88x trailing P/E, 37.71x forward P/E, FY2026 EPS estimate of $11.55, average target of $456 | Shows how much execution is already priced in |
| FactSet, April 2, 2026 | Technology revisions and positive guidance breadth stayed firm | Supports the wider AI and semis backdrop |
| BLS and BEA, April-May 2026 | Inflation stayed above target even as GDP expanded | Explains why the multiple is still rate-sensitive |
| IMF, April 1, 2026 | 2.4% U.S. growth outlook and lower core PCE by H1 2027 | Defines the macro base case under which Broadcom's forward multiple is easiest to defend |
05. Scenarios
Scenario analysis with probabilities and review points
For 2027, the measurable catalysts are unusually clear: the June 3, 2026 earnings report, AI semiconductor revenue progression, software growth, and whether consensus EPS keeps stepping higher.
Each scenario below is designed to be monitored with current valuation, earnings, and macro data rather than a vague long-term story. When the trigger changes, the range should change with it.
| Scenario | Probability | Range / implication | Trigger | When to review |
|---|---|---|---|---|
| Bull | 30% | $616 to $653 | Q2 revenue reaches or exceeds the $22.0 billion guide, AI semiconductor revenue sustains the move from $8.4 billion in Q1 toward $10.7 billion, and FY2026 EPS estimates move above $11.55 | First review on June 3, 2026, then again after the following quarter |
| Base | 50% | $580 to $592 | Broadcom delivers on the current revenue ramp but the stock tracks earnings growth more than further multiple expansion | Review after each quarterly report and every significant AI customer update |
| Bear | 20% | $454 to $476 | AI revenue growth cools, software remains flat, or a higher-rate tape causes a de-rating before EPS catches up | Review immediately if Q2 misses the $22.0 billion guide or if free-cash-flow conversion weakens |
References
Sources
- Broadcom Q1 fiscal 2026 results filed with the SEC
- StockAnalysis Broadcom statistics and valuation snapshot
- StockAnalysis Broadcom analyst target and EPS forecast snapshot
- U.S. CPI April 2026 release
- U.S. Personal Income and Outlays March 2026
- U.S. GDP advance estimate for Q1 2026
- IMF 2026 U.S. Article IV consultation
- FactSet S&P 500 earnings season preview for Q1 2026