Funnel charts represent different stages of a process. Funnel charts typically depict how different stages merge into a smaller output. Different popular versions of funnel charts include sales, marketing, recruitment, and conversion funnel charts. Here's how to create a funnel chart in PowerPoint.
How to Create a PowerPoint Funnel Chart Using SmartArt Graphics
Step 1:
At the PowerPoint interface, users click on Insert then click on SmartArt to insert.
Step 2:
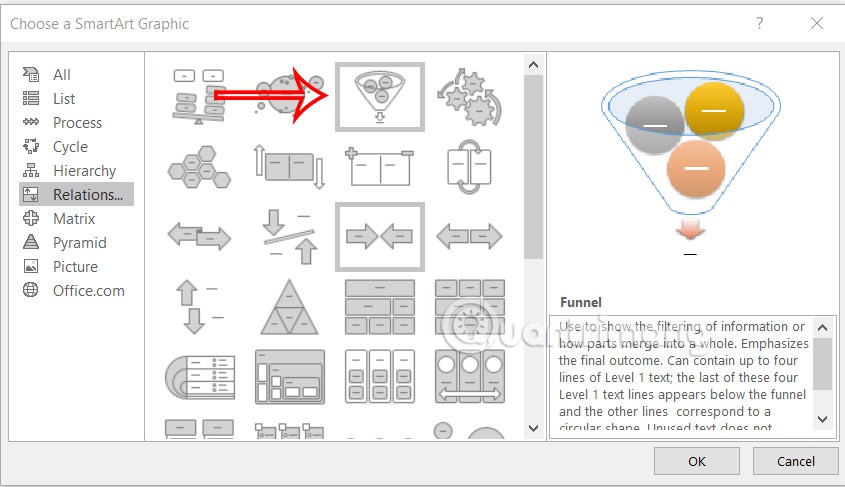
Display the interface for you to choose the chart. We click on the Relationship chart group and then look to the right and select Funnel .
Step 3:
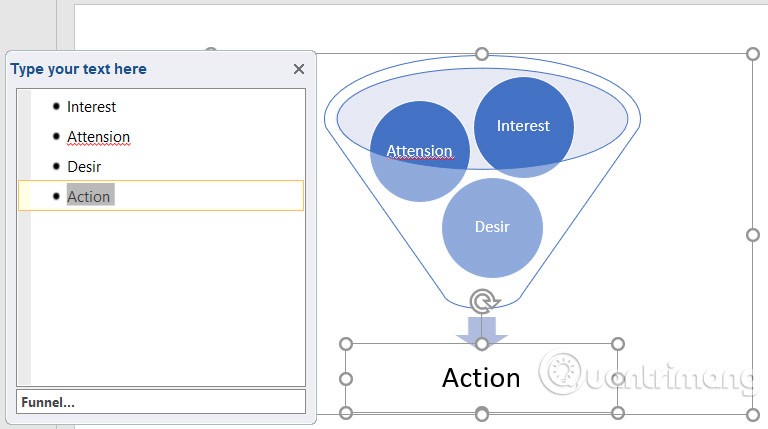
Now we will see the funnel chart. Now you can add new text, change the color of the diagram,...
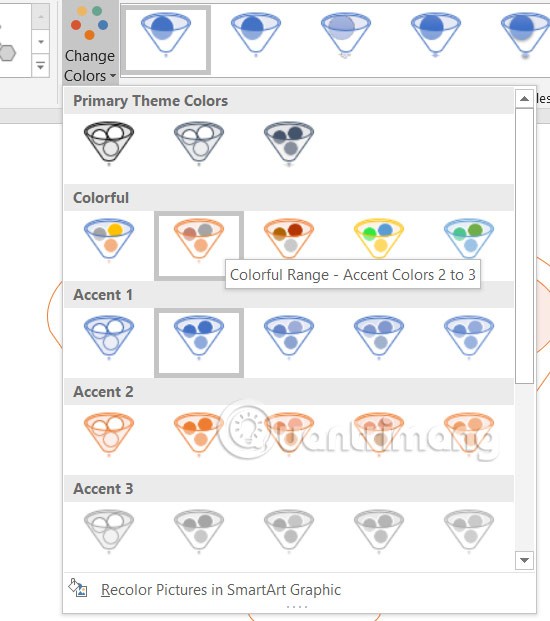
If you want to change the color of the chart , click Change Colors and select the color below.
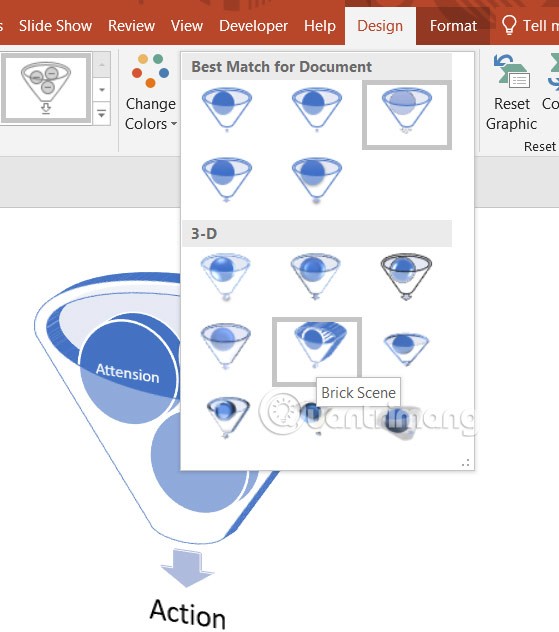
You can also change the display style of the funnel chart in PowerPoint. Click SmartArt Styles and select the chart display style.
How to Create a Funnel Chart in PowerPoint Using Shapes
Step 1:
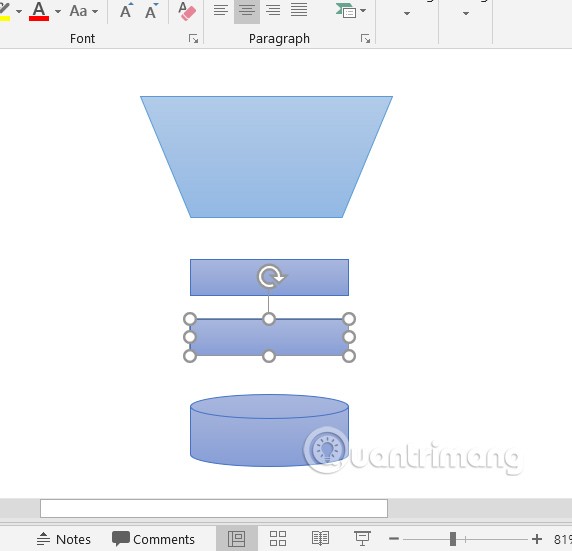
Click on Insert and select Shape , then select the trapezoid from the list below. Then draw it into the slide.

Continue drawing 2 more rectangles below the trapezoid . Then add a cylinder at the bottom of the chart.
Step 2:
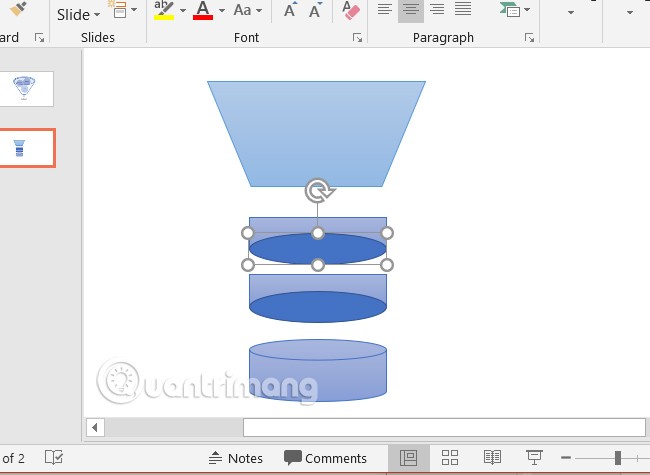
To create the funnel shape , we will select the oval in Shapes and insert 2 rectangles below it .
Step 3:
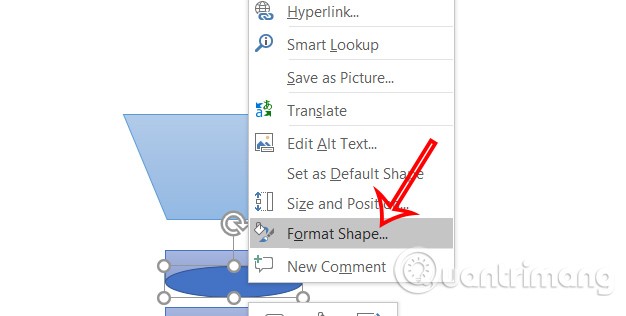
To adjust the shape , click on the oval and right-click and select Format Shape .
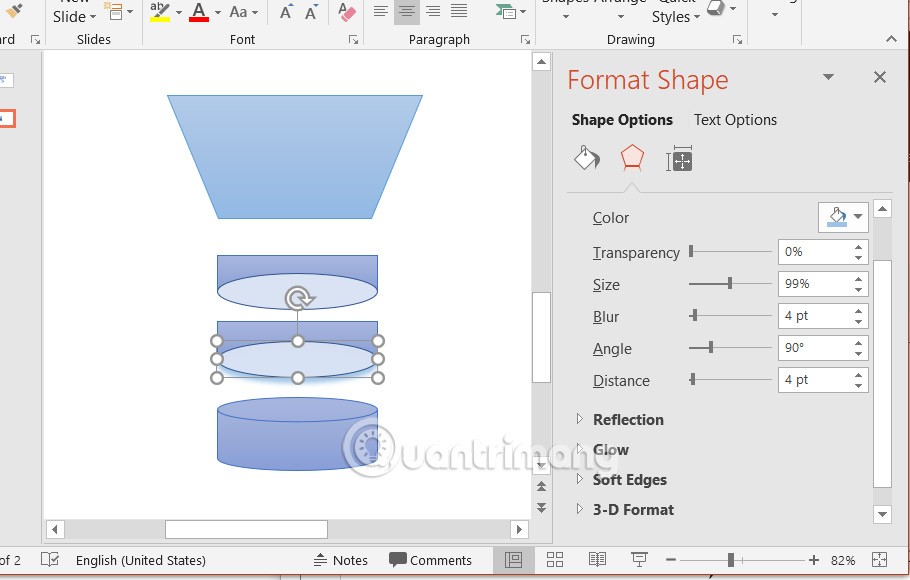
Now users can adjust color, size, position, brightness,...
Step 4:
Now press the SHIFT key and left click on the rectangle and oval to select, then right click and select Group to group the objects.
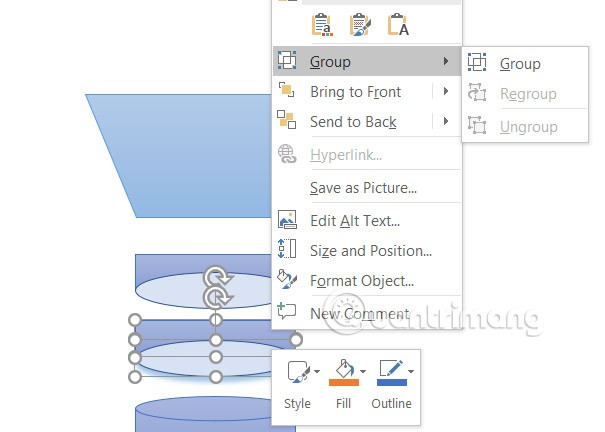
Finally we write the content into the funnel chart in PowerPoint.

Video tutorial on creating a PowerPoint funnel chart


