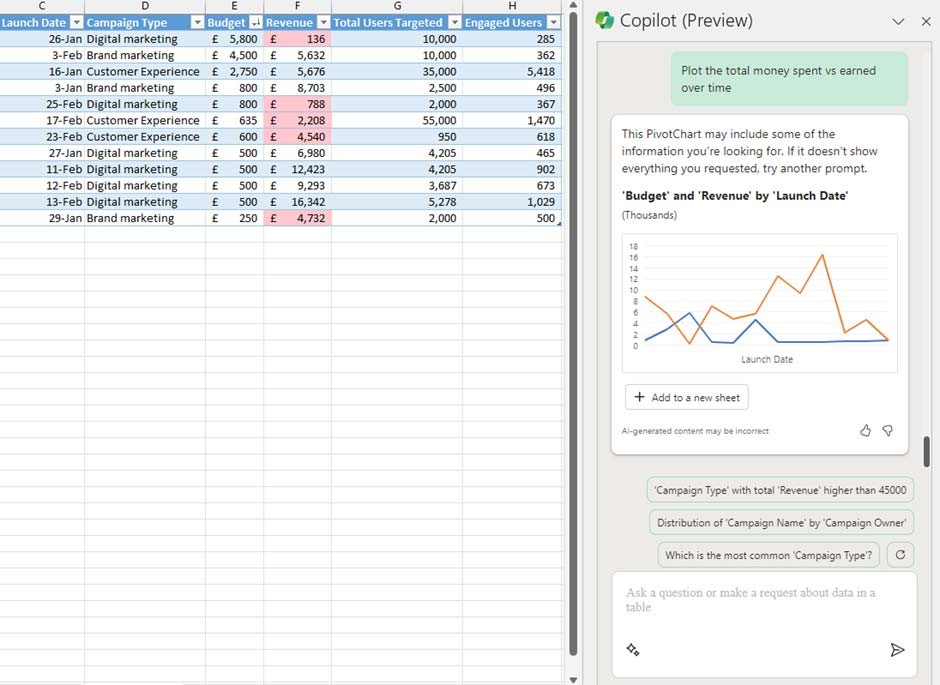
Microsoft Copilot is an AI assistant that can be integrated into many MS Office applications, including Excel. With Copilot, users can completely use it to summarize data, organize spreadsheets, and support formulas in Excel data tables. Thus, we have an additional support tool to process data tables in Excel. Below are instructions for using Copilot in Excel.
How to use Copilot in Excel
Step 1:
After adding Copilot to Excel , click the Copilot icon in the upper right corner to use it.
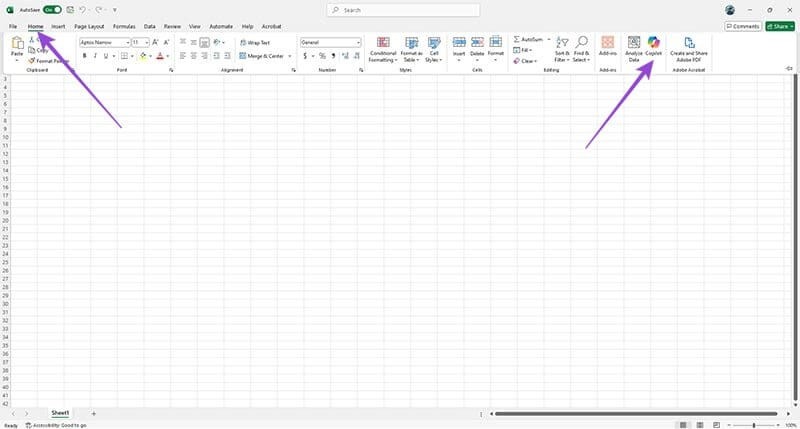
Step 2:
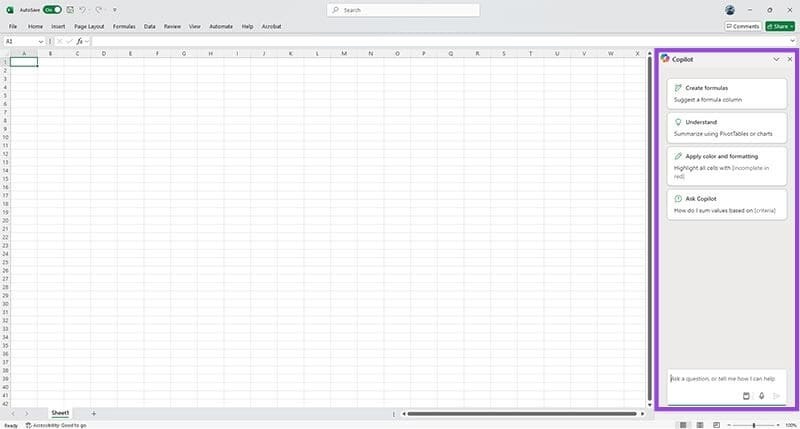
Now on the right side of the interface will display a chat board with Copilot for us to use. Here the user can enter the request they want Copilot to process the data table in Excel.
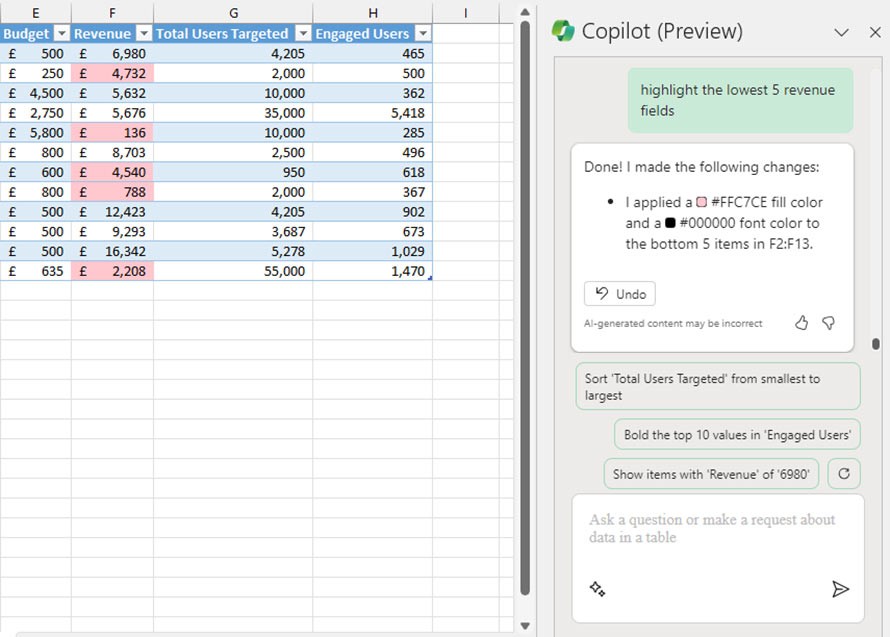
For example, if you want Copilot to filter the 5 lowest revenue values, you enter Highlight the lowest 5 revenue fields. At this time, Copilot will analyze the data to find the 5 lowest values. As a result, you will see those 5 values highlighted in the table.
The Copilot editing feature in Excel can also help you sort and filter data. For example, if you want to sort the budget column from largest to smallest, type Sort the budget column largest to smallest.
In addition to processing data, Copilot also has the ability to draw charts, according to your requirements. For example, if you want to draw a chart of total money spent compared to the amount earned over time, Copilot analyzes the data, identifies the date column, budget column and revenue column. Then, Copilot suggests a chart, you click Add to new sheet to insert the chart into the content .
