As of October 7, 2026, Nike’s stock trend is best read as a recovery question, not a simple chart pattern. The newest results show some improving signals in gross margin and inventory, but revenue is still falling and Nike expects a high-single-digit decline for fiscal 2027. For a new investor, the useful task is to decide what evidence would confirm or weaken a recovery thesis, then check the share-price trend against that evidence over time.
NIKE, Inc. (NYSE: NKE) reported a fiscal first-quarter close of August 31 on October 1. Its reported revenue was $11.2 billion, down 4% from the prior-year quarter; diluted earnings per share were $0.48. At the October 6 close, NKE was $34.25, according to historical market data. This is a dated snapshot, not a target or forecast. Quotes change during trading, and a single week cannot establish a durable trend.

1. Start with the question you want the chart to answer
A stock-price trend is the direction and persistence of a share price across a chosen period. Before opening a chart, choose a question: Is NKE stabilizing after a decline? Is it outperforming the broader market? Or is a recent bounce lasting long enough to matter? The question determines the timeframe. A one-day chart is useful for seeing an earnings reaction; a six- or twelve-month view is more useful for judging whether that move fits a larger pattern.
Write down the period and comparison before looking for patterns. For example, an investor might compare NKE’s six-month total return with the S&P 500 and a footwear or apparel peer group. A total return includes reinvested dividends; a price return does not. Compare like with like, and use the same dates and currency. This prevents a chart from appearing stronger simply because it uses a favorable starting point.
2. Prepare reliable inputs before reading signals
Use daily prices that are adjusted for stock splits, and check whether a chart includes dividends. Nike’s own historical price lookup provides a company source for checking price history. For business context, start with the company’s fiscal 2027 first-quarter release and its Form 10-Q filed with the SEC. The SEC filing gives the detail behind the headlines, including channel, region, and inventory data.
Keep three items beside the chart: the company’s latest guidance, a small set of operating measures relevant to the business, and a record of major news dates. Nike’s measures include revenue growth, gross margin, inventory, and results by channel and region. These measures help distinguish a price move based on improving business performance from one driven mainly by changing expectations or market-wide sentiment.
3. Read the chart in a simple order
Look at direction and structure first
Start with the sequence of highs and lows. Higher highs and higher lows can indicate an advancing trend; lower highs and lower lows can indicate persistent selling pressure. A sideways range has neither pattern consistently. These descriptions summarize past trading; they do not predict what comes next. In a volatile stock, zooming out matters because a sharp one-week rebound can still sit inside a longer decline.
Use moving averages as summaries, not signals by themselves
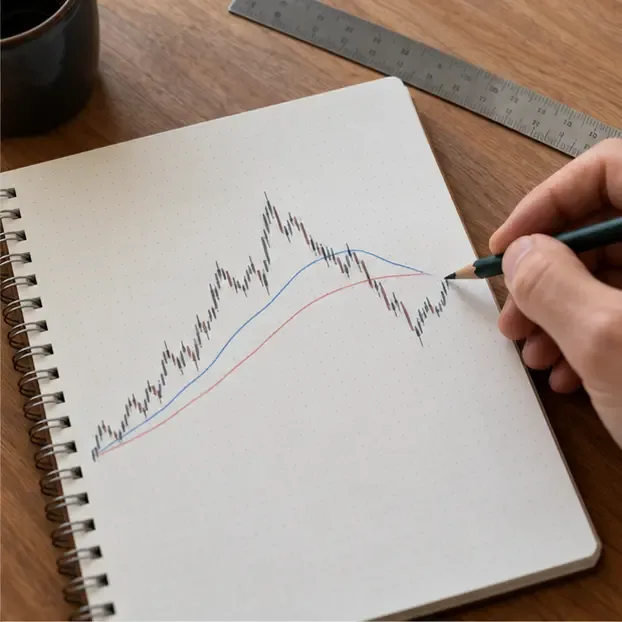
A moving average is the average closing price over a rolling period, often 50 or 200 trading days. It smooths short-term noise and makes the direction easier to see. If price remains below a declining long-term average, that is evidence of weakness; a close above a rising average may indicate improving momentum. Neither event proves that a low is in. Prices can cross an average repeatedly in choppy markets, so look for follow-through and compare the signal with company results.
Check trading volume and the market backdrop
Trading volume is the number of shares exchanged during a period. A price change on unusually high volume can show stronger participation, although volume alone does not reveal whether traders are buying for long-term reasons. Then compare NKE with a broad benchmark and a relevant peer group. If Nike falls while the whole market and peers fall too, some pressure may be market-wide. If NKE persistently lags both, company-specific concerns may be playing a larger role. A peer comparison is context, not proof of cause.
4. Apply the process to Nike’s October 2026 setup
For a short-term example, historical data show NKE closing at $35.15 on October 1 and $33.87 on October 2, before it ended at $34.25 on October 6. That sequence captures a sharp post-results drop followed by a modest rebound. It does not by itself show that the longer-term trend has reversed. Check the dates and prices against a live or official historical quote source before using them; market feeds can be revised or delayed.
The fundamentals explain why a bounce needs confirmation. In the first quarter, Nike’s gross margin improved 60 basis points to 42.8%, and inventories were $7.8 billion, down 3% year over year. At the same time, revenue declined 4%; Nike Direct revenue was down 9% on a currency-neutral basis; and Greater China revenue fell 26% on a currency-neutral basis. The first two figures may support a stabilization case, while the sales declines identify problems still to solve.
Nike’s October 1 outlook expects fiscal 2027 revenue to decline in the high single digits. The company also described its Pace operating-model program, estimating approximately $2.5 billion in cumulative savings through fiscal 2031 alongside approximately $1.0 billion in pre-tax charges. Those are management estimates, not guaranteed outcomes. A new investor can use them as checkpoints: later reports should show whether revenue trends, margins, and inventory are improving, and whether any savings arrive without undermining product demand or execution.

5. Make a review plan and define what would change your view
Choose a review cadence that matches your timeframe. A long-term investor could update the chart after each earnings report rather than reacting to each daily move. Record a few conditions that would strengthen or weaken the thesis. For Nike, examples to monitor include whether revenue declines moderate, whether gross margin holds or improves, whether Direct and wholesale channels stabilize, and whether Greater China improves. On the chart, watch whether price stops making lower lows and begins to hold above important averages, but treat those as supporting evidence, not a buy instruction.
- Evidence that would improve the setup: a sustained price base, stronger relative performance, and operating results moving in the same direction.
- Evidence that would weaken it: fresh lows alongside continued revenue deterioration, renewed discounting, or guidance cuts.
- When to reassess: after a major earnings release, a material guidance change, or a break in the price pattern you wrote down in advance.
Do not use a stop-loss, moving-average cross, or price target as a substitute for sizing risk. A stop order may execute at a different price during a gap or fast market. If you are considering a position, decide in advance how much loss you could tolerate, avoid investing money needed soon, and consider whether a diversified fund better fits your goal than one company’s stock.

Common mistakes for a first-time chart reader
- Calling one rebound a reversal. Require more than a few sessions; look for sustained structure and improving relative strength.
- Using a single indicator as proof. A moving average or volume spike is descriptive evidence, not a forecast.
- Ignoring the earnings quality. Fiscal 2026 fourth-quarter EPS included a $0.52 benefit related to an expected tariff recovery, so a headline earnings increase should be examined for one-time items.
- Mixing chart periods or return types. Use consistent dates, split-adjusted prices, and the same treatment of dividends for NKE and its comparators.
- Treating company guidance as certain. Management outlook depends on assumptions and can change; compare it with later reported results.
A practical conclusion for October 2026
NKE’s near-term chart reflects meaningful uncertainty: the stock fell after the October 1 report and recovered only part of that move by October 6. Nike has signs worth monitoring, including a higher first-quarter gross margin and lower year-over-year inventory, but its revenue outlook remains negative and important business lines are still under pressure. For a beginner, the strongest process is to set a timeframe, verify the chart, connect price action to official operating results, and decide in advance which evidence would change the thesis. A trend analysis can organize a decision; it cannot remove the risk of being wrong.
Data cutoff: October 7, 2026. Historical market prices are snapshots and may vary by data provider. This article is educational and is not individualized investment advice.
Sources
- NIKE, Inc., fiscal 2027 first-quarter results, October 1, 2026
- NIKE, Inc., Form 10-Q for the quarter ended August 31, 2026
- NIKE, Inc., fiscal 2026 fourth-quarter and full-year results
- NIKE, Inc., historical stock price lookup
- Daily NKE historical prices, with S&P Global Market Intelligence identified as its data source