01. Historical Context
Sanofi in context: the 2027 call starts from the current valuation gap
As of May 15, 2026, Sanofi traded at EUR 74.04, near its 52-week low of EUR 71.73 and well below the 52-week high of EUR 94.10. Over the past 10 years, the stock has ranged from EUR 44.62 to EUR 94.70, and its adjusted-price CAGR has been 4.1%. That matters because the stock has not historically been a momentum compounder; it has been a cash-flow and pipeline rerating story.
The latest operating data are stronger than the share price implies. Q1 2026 net sales were EUR 10.509 billion, up 13.6% at constant exchange rates, while business EPS was EUR 1.88, up 14.0% at CER. Dupixent contributed EUR 4.2 billion in Q1 2026, up 30.8%; launches added EUR 1.2 billion, up 49.6%; vaccines were EUR 1.3 billion, up 2.1%. For 2026, management reaffirmed high single-digit sales growth at CER and business EPS growth at CER slightly faster than sales, before share buybacks.
The valuation anchor is clear. MarketScreener showed Sanofi on about 12.9x trailing 2025 earnings, 10.9x 2026 estimated earnings, and 10.1x 2027 estimated earnings. Consensus EPS on MarketScreener was EUR 6.852 for 2026 and EUR 7.372 for 2027, implying about 7.6% growth into 2027. When a large-cap pharma business is growing launches at nearly 50% and trades around 11x forward earnings, the burden of proof shifts to whether the pipeline can offset concentration risk rather than whether the valuation is already euphoric.
| Horizon | What matters now | Current datapoint | What would strengthen the thesis |
|---|---|---|---|
| 1-3 months | Execution versus guidance | Q1 2026 net sales were EUR 10.509 billion, up 13.6% at constant exchange rates, while business EPS was EUR 1.88, up 14.0% at CER. | Management keeps 2026 guidance and brand-level momentum remains intact. |
| 6-18 months | Valuation versus revisions | MarketScreener showed Sanofi on about 12.9x trailing 2025 earnings, 10.9x 2026 estimated earnings, and 10.1x 2027 estimated earnings. Consensus EPS on MarketScreener was EUR 6.852 for 2026 and EUR 7.372 for 2027, implying about 7.6% growth into 2027. | Consensus EPS moves higher while the multiple does not need to do all the work. |
| To 2027 | Structural compounding | 10-year price range EUR 44.62 to EUR 94.70; 10-year CAGR 4.1%. | The company sustains growth through launches, pipeline conversion, and disciplined capital allocation. |
02. Key Forces
What has to go right for the 2027 target to move higher
The first force is Dupixent durability. Dupixent was above EUR 4 billion again in Q1 2026 and remains the central earnings engine. If volume and new indications keep extending the franchise, Sanofi can fund the rest of the pipeline without stretching the balance sheet.
The second force is launches. Sanofi reported EUR 1.2 billion of launch sales in Q1 2026, up 49.6%, led by ALTUVIIIO, Ayvakit, and Sarclisa. For a 2027 target to move higher, launches need to keep replacing older product drag rather than simply offsetting it.
The third force is capital allocation. Sanofi completed EUR 921 million of its EUR 1 billion buyback program by Q1 2026 and still carries optionality from its Opella stake after receiving EUR 10.4 billion in net cash proceeds when the transaction closed in 2025.
The fourth force is FX. At January 2026 exchange rates, Sanofi estimated a roughly negative 2% FX impact on sales and negative 3% on business EPS for FY 2026. That is not a thesis breaker, but it explains why reported growth can lag constant-currency growth and why investors should separate operating momentum from translation noise.
The fifth force is sentiment versus fundamentals. The stock trades much closer to its 52-week low than to the analyst target range, so even a modest improvement in revisions could reopen upside without requiring a peak multiple.
| Factor | Current Assessment | Bias | Why it matters now |
|---|---|---|---|
| Valuation | About 10.9x 2026 EPS and 10.1x 2027 EPS. | Bullish | The stock is priced like a slow grower while launches and Dupixent are still compounding. |
| Core franchise | Dupixent Q1 sales EUR 4.2 billion, up 30.8%. | Bullish | One product is carrying a large part of the earnings base, but it is still growing fast. |
| Launch engine | Launch sales EUR 1.2 billion, up 49.6%. | Bullish | New products are the clearest bridge from 2026 strength to a 2027 rerating. |
| FX translation | Sanofi flagged about negative 2% sales and negative 3% EPS FX drag for 2026 at January rates. | Neutral | Reported numbers can look softer than CER performance. |
| Concentration risk | Dupixent is roughly 40% of Q1 group sales. | Neutral to Bearish | The thesis weakens quickly if Dupixent slows before launches are large enough. |
03. Countercase
What could break the 2027 thesis
The main risk is concentration. Dupixent generated roughly 40% of group sales in Q1 2026. If market expectations start to discount a slower Dupixent growth curve or more intense competitive pressure, the multiple can stay low even if the rest of the portfolio improves.
The second risk is that 2026 reported growth could look less impressive than CER growth because of FX. Sanofi itself warned that, at January rates, exchange movements would subtract about 2% from sales and 3% from business EPS for the full year.
The third risk is that the launch mix underdelivers. A stock that screens at around 11x forward earnings can still stay cheap if investors decide the post-Dupixent bridge is not yet visible enough.
The fourth risk is the macro tape. FactSet said on May 1, 2026 that Health Care was one of only two S&P 500 sectors reporting a year-over-year earnings decline, while the broad market traded at 20.9x forward earnings. In that kind of market, money can still ignore cheap healthcare until revisions improve.
| Risk | Latest datapoint | Current assessment | Bias |
|---|---|---|---|
| Dupixent dependence | EUR 4.2 billion Q1 2026 sales, up 30.8% | High but still productive | Neutral to Bearish |
| FX drag | Management guide: about negative 2% sales and negative 3% EPS at January 2026 rates | Active headwind | Bearish |
| Sector revision breadth | FactSet: Health Care one of two sectors with earnings decline in Q1 2026 | Mixed backdrop | Neutral |
| Valuation trap risk | Stock near 52-week low despite double-digit CER growth | Needs proof from launches | Neutral |
04. Institutional Lens
What the better institutional inputs say right now
The institutional setup is unusually clear for a stock like Sanofi. MarketScreener listed 24 analysts on May 7, 2026 with an Outperform consensus, average target EUR 97.10, low target EUR 82.00, and high target EUR 112.00. That tells you the Street sees value, but not enough conviction yet to call the rerating complete.
IMF and sector work matter because Sanofi is still an equity, not a bond proxy. The IMF's April 2026 baseline called for 3.1% global growth in 2026 and 3.2% in 2027, but also stressed downside risks from conflict and fragmentation. That is a decent backdrop for defensive pharma, but not a reason to pay any price.
J.P. Morgan Asset Management's 2026 healthcare note is relevant because it argues public healthcare multiples are at 30-year lows relative to the S&P 500 even after USD 318 billion of M&A in 2025. If policy noise fades, stocks like Sanofi can rerate from a low base.
| Source | Latest update | What it says | Why it matters here |
|---|---|---|---|
| MarketScreener, May 7, 2026 | MarketScreener listed 24 analysts on May 7, 2026 with an Outperform consensus, average target EUR 97.10, low target EUR 82.00, and high target EUR 112.00. | Analysts still see upside because the stock is screening at a low-teens trailing P/E and about 11x forward earnings. | That institutional setup matters because Sanofi does not need an aggressive multiple to outperform if launches keep delivering. |
| IMF, April 2026 | Global growth 3.1% in 2026 and 3.2% in 2027. | The IMF said downside risks still dominate because of conflict, fragmentation, and disappointment over AI productivity. | A slower macro tape usually limits multiple expansion for defensive growth names as well as cyclical names. |
| FactSet, May 1, 2026 | Health Care was one of only two S&P 500 sectors reporting a year-over-year earnings decline; the S&P 500 forward P/E was 20.9x. | FactSet's message is that broad equity valuations are not cheap even as healthcare revisions remain mixed. | That raises the bar for stock-specific execution and makes relative valuation important. |
| J.P. Morgan Asset Management, 2026 | Public healthcare multiples sit at 30-year lows relative to the S&P 500 despite USD 318 billion of M&A across 2,500-plus transactions in 2025. | J.P. Morgan's sector view is that policy noise has compressed healthcare valuations relative to the market. | That helps explain why solid pharma execution can still re-rate if policy fears fade. |
05. Scenarios
Scenario analysis with explicit triggers, probabilities, and review dates
The cleanest way to forecast 2027 is to tie price ranges to earnings delivery and what multiple the market is willing to pay. The stock does not need an Eli Lilly-style premium to work; it needs launches to keep proving that 2025 and Q1 2026 were not one-off good quarters.
Every scenario below has a review point. For Sanofi, the natural checkpoints are the Q2 2026 results on July 30, 2026, the FY 2026 print in early 2027, and whether consensus 2027 EPS keeps moving toward or above the current EUR 7.372 estimate.
| Scenario | Probability | Target range | Trigger | When to review |
|---|---|---|---|---|
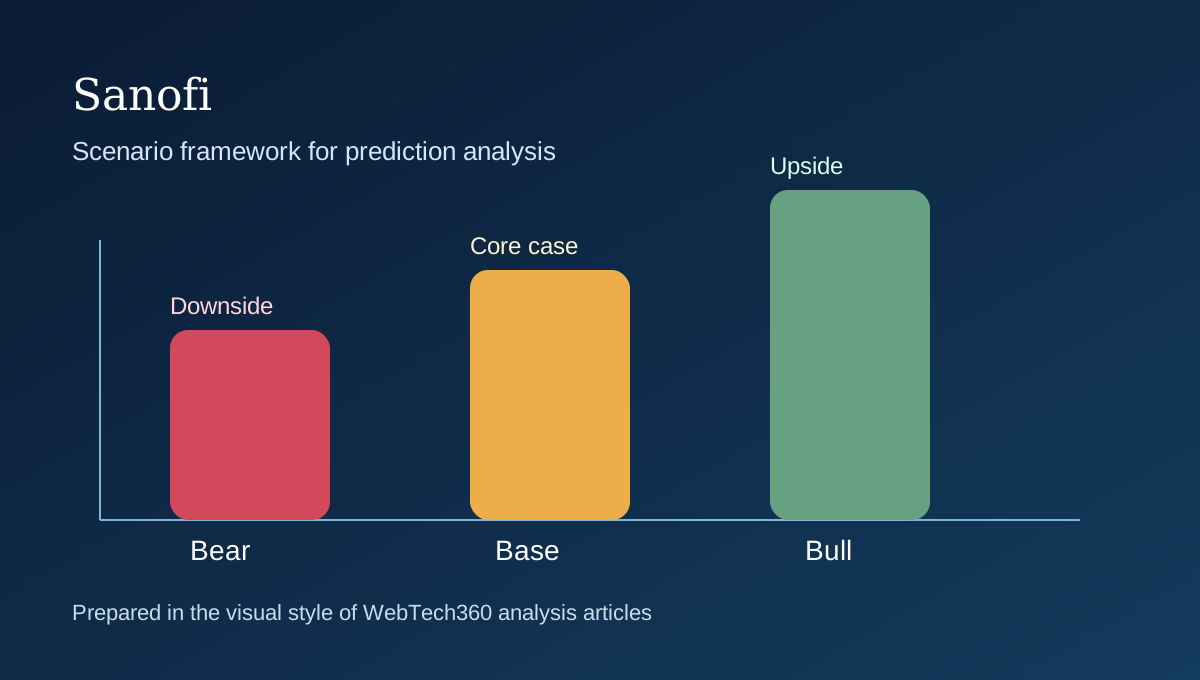
| Bull case | 25% | EUR 100 to EUR 115 | Dupixent keeps growing above 20%, launches remain above 30% growth, and 2027 EPS trends above EUR 7.7. | Review after FY 2026 and after each major immunology readout. |
| Base case | 50% | EUR 83 to EUR 97 | 2026 sales grow high single digits at CER, business EPS grows at least slightly faster than sales, and the stock rerates only to roughly 11.5x to 13x 2027 EPS. | Reassess after Q2 2026 and FY 2026 results. |
| Bear case | 25% | EUR 62 to EUR 74 | Dupixent growth slips, launches fail to offset aging brands, or FX and sector revisions keep the stock below 10x forward earnings. | Reassess if the stock breaks the 52-week low or 2027 EPS estimates are cut. |
References
Sources
- Yahoo Finance chart endpoint for Sanofi (SAN.PA), used for current price and 10-year range
- Sanofi press release: Q1 2026 double-digit sales and business EPS growth, published April 23, 2026
- Sanofi press release: FY 2025 strong sales and EPS growth, published January 29, 2026
- MarketScreener Sanofi financial forecasts and valuation ratios
- MarketScreener Sanofi analyst consensus and target prices
- IMF World Economic Outlook, April 2026
- FactSet S&P 500 Earnings Season Update, May 1, 2026
- J.P. Morgan Asset Management: Healthcare growth equity in 2026