01. Historical Context
Siemens in context: why 2030 depends on compounding, not on one headline
The base case is straightforward: Siemens still has enough operating evidence to justify a constructive stance, but the return path depends on whether execution continues to outrun a tougher macro backdrop. Recent price action matters only because it now sits on top of specific, checkable numbers rather than on a vague story.
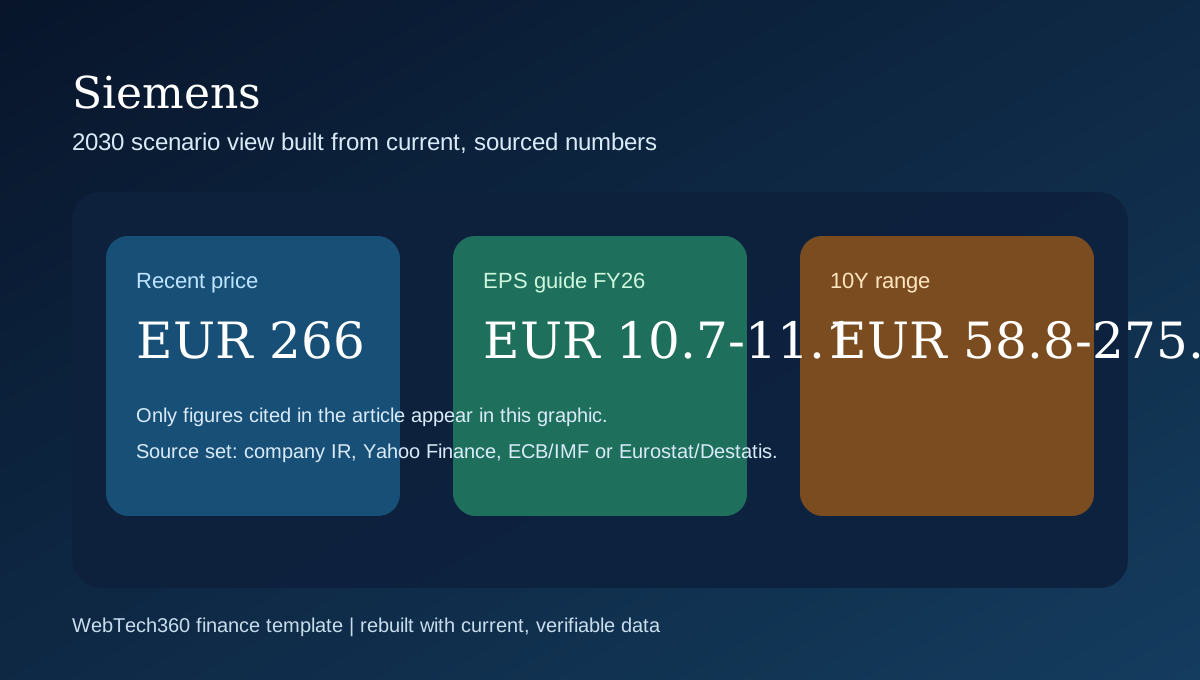
As of May 13, 2026, recent Yahoo Finance quote pages showed Siemens around EUR 266.35, with a 52-week range of EUR 198.00 to EUR 275.75. The longer context is important too. MarketScreener's ten-year range snapshot put the stock between EUR 58.77 to EUR 275.75, which is why the next move should be judged against long-cycle valuation discipline, not just the last quarter.
| Horizon | What matters most | What would strengthen the thesis | What would weaken the thesis |
|---|---|---|---|
| 1-3 months | Q2 FY2026 execution, backlog quality, and valuation discipline | Orders stay above revenue, the book-to-bill ratio holds above 1.1, and the stock consolidates near highs instead of failing at them | A margin miss in Mobility or Smart Infrastructure, or a fast de-rating after Germany and euro area inflation stay sticky |
| 6-18 months | Whether software, electrification, and AI-linked demand sustain high-quality earnings | Digital Industries keeps margin above 17%, Smart Infrastructure keeps record order intake translating into revenue, and EPS tracks the EUR 10.70-EUR 11.10 FY2026 guide | The software cycle fades, tariffs keep biting Mobility, or the market refuses to pay mid-20s earnings multiples |
| To 2030/2035 | Compounding of software, infrastructure, and industrial AI | Revenue growth stays near the 6%-8% FY2026 group corridor and AI monetization improves the mix | Execution stays good but multiples compress toward the high teens |
02. Key Forces
The five forces that matter most from here to 2030
The first question is valuation. Siemens does not trade in a vacuum. The market is already expressing a view about the durability of earnings through today's multiple, and that multiple must be reconciled with current guidance, not with optimistic language. Recent Yahoo Finance statistics placed the stock near 26.5x trailing earnings and 24.5x forward earnings.
The second question is whether macro conditions are helping or hurting the next leg. ECB staff projections from March 2026 still point to euro area GDP growth of 0.9% in 2026, while Eurostat's flash estimate showed euro area inflation at 3.0% in April 2026. That is not recessionary, but it is not a clean disinflation backdrop either.
The third question is quality of execution. A stock can absorb macro noise when orders, margins, and cash conversion keep beating expectations. It struggles when investors have to defend the thesis with adjectives instead of data.
| Factor | Current Assessment | Bias | What the latest data says |
|---|---|---|---|
| Demand visibility | Improving | Bullish | Q2 FY2026 orders rose to EUR 24.1 billion and backlog reached a record EUR 124 billion. |
| Valuation | Full but supported by execution | Neutral | Recent Yahoo Finance snapshots put Siemens around 26.5x trailing and 24.5x forward earnings. |
| Cash generation | Strong | Bullish | Group free cash flow rose to EUR 1.7 billion in Q2 FY2026 and reached a record EUR 10.8 billion in fiscal 2025. |
| AI and software mix | Positive | Bullish | H1 FY2026 digital business growth was 19%, software ARR reached EUR 5.5 billion, and Siemens is deploying EUR 1 billion into industrial AI. |
| Macro and rates | Still a live constraint | Neutral | Euro area inflation printed 3.0% in April 2026, while ECB staff still expect 0.9% GDP growth for 2026. |
03. Countercase
What would break the 2030 thesis
The main bearish case is not that the business suddenly stops working. It is that the market asks for a lower multiple at the same time that one or two operating lines soften. When inflation stops falling cleanly and investors have already paid up for a good story, the downside can come from valuation first and fundamentals second.
The other risk is timing. Guidance is only useful if investors trust that it still fits the environment. That trust usually weakens quickly once tariffs, input costs, or regional demand stop behaving the way management assumed at the beginning of the year.
| Risk | Latest data point | Why it matters now |
|---|---|---|
| Multiple compression | Germany CPI was 2.9% in April 2026 and euro area inflation 3.0%. | If inflation stays sticky, Siemens can keep growing while the stock still de-rates from mid-20s P/E. |
| Tariff exposure | Mobility margin fell to 6.9% from 9.1% in Q2 FY2026 due mainly to U.S. tariff impacts. | A broader tariff pass-through would hit the most operationally leveraged part of the story. |
| Execution slippage | FY2026 guidance still assumes 6%-8% comparable revenue growth and EPS pre PPA of EUR 10.70-EUR 11.10. | A miss versus that corridor would be punished because the shares are already near the 52-week high. |
| Acquisition integration | ROCE fell to 13.0% in Q2 FY2026 as capital employed rose after Altair and Dotmatics. | If integration costs last longer than expected, quality of growth matters more than top-line growth. |
04. Institutional Lens
What current institutional data says about the long-range setup
The institutional picture is clearest when sources are separated. IMF and ECB publications define the macro corridor. Company releases define what management is actually delivering. Market data services such as Yahoo Finance define what investors are already pricing.
For Siemens, the numbers currently point to a market that is neither blind nor complacent. The stock is not priced as a distressed asset. It is also not priced for perfection in the same way a hyper-growth software name might be. That is why scenario analysis remains more useful than a single heroic target.
| Source | Updated | What it says | Type |
|---|---|---|---|
| Siemens | May 13, 2026 | Q2 FY2026 orders EUR 24.1 billion, book-to-bill 1.22, backlog EUR 124 billion, EPS pre PPA EUR 2.81; FY2026 EPS guide kept at EUR 10.70-EUR 11.10. | Company release |
| Yahoo Finance | May 2026 snapshots | Recent market snapshots showed Siemens around EUR 266.35, trailing P/E near 26.5x, forward P/E near 24.5x, and a 1-year target estimate of EUR 277.12. | Market data and analyst consensus |
| Siemens Annual Report | Fiscal 2025 | Revenue EUR 78.9 billion, net income EUR 10.4 billion, EPS pre PPA EUR 12.95, and free cash flow EUR 10.8 billion. | Annual report |
| ECB | March 2026 projections | Euro area GDP growth 0.9% in 2026 and headline inflation 2.6% in 2026. | Macro baseline |
| IMF | April 2026 WEO | Global growth projected at 3.1% in 2026. | Global macro baseline |
05. Scenarios
Probability-weighted 2030 scenarios that can actually be monitored
The 2030 framework should start from current price, current valuation, and the past decade's trading history. For Siemens, that means using EUR 266.35 as the current anchor, EUR 58.77 to EUR 275.75 as the longer-cycle reference, and today's operating guidance as the bridge between those two points.
The purpose of the scenarios below is not to imply certainty. It is to define what would need to happen for each range to make sense, and when the thesis should be reviewed again.
| Scenario | Probability | Target range / outcome | Trigger | When to review |
|---|---|---|---|---|
| Bull | 20% | EUR 430-EUR 500 | Execution keeps beating guidance, valuation stays resilient, and the key growth engines keep taking mix share. | Review after each full-year report; major checkpoint at fiscal 2027 and fiscal 2028 results. |
| Base | 55% | EUR 340-EUR 400 | Growth stays positive, cash flow holds up, and multiples drift only modestly from today's levels. | Review after each full-year report; re-underwrite if two consecutive quarters miss the operating pattern. |
| Bear | 25% | EUR 230-EUR 290 | Inflation stays sticky, regional demand disappoints, and the market cuts the valuation range. | Reassess immediately after a guidance cut or after macro conditions move decisively against the thesis. |
References
Sources
- Yahoo Finance quote for Siemens (current price, 52-week range, target estimate)
- Yahoo Finance statistics snapshot for Siemens (valuation measures as of May 2026)
- Siemens Q2 FY2026 earnings release PDF
- Siemens Annual Report 2025
- Siemens industrial AI launch: Eigen Engineering Agent
- IMF World Economic Outlook, April 2026
- ECB staff macroeconomic projections for the euro area, March 2026
- Eurostat flash inflation for April 2026
- Destatis Germany CPI for April 2026
- MarketScreener Siemens quote page (10-year trading range snapshot)