01. Historical Context
SMI Index in context: what the current regime is actually pricing
SMI Index should be framed as a regime call, not a slogan. The relevant question is whether verified growth, inflation, and earnings conditions justify further upside from here, not whether a dramatic headline target sounds exciting.
| Horizon | What matters most | Current assessment | What would weaken the thesis |
|---|---|---|---|
| 1-3 months | Macro and earnings validation | The Swiss CPI was 0.3% year on year in March 2026 and core inflation was 0.4%, according to the FSO. | iShares SMI ETF (CH) showed 20.79x P/E, 3.99x P/B, and 2.58% trailing yield as of May 6, 2026. |
| 6-18 months | Can profits outrun rate friction? | Through 2030, SMI looks more like a quality-compounding market than a cyclical breakout market. A realistic base case is 16,562 to 18,706. | Premium multiples compress while growth remains only average |
| To 2030 | Can the benchmark compound without a major rerating? | Base case remains data-supported | Repeated negative revisions or valuation compression |
SMI finished April 2026 at 13,136.3, according to the latest SIX exchange figures. iShares SMI ETF (CH) showed 20.79x P/E, 3.99x P/B, and 2.58% trailing yield as of May 6, 2026. Those two numbers matter together because they separate raw price momentum from the valuation investors are currently paying for it.
The Swiss CPI was 0.3% year on year in March 2026 and core inflation was 0.4%, according to the FSO. The latest official GDP print available in mid-May 2026 was Q4 2025 at +0.2% q/q; SECO forecast 2026 GDP growth at 1.0% and 2027 at 1.7%. For a forecast into 2030, the market does not need perfect data. It does need enough evidence that earnings can outgrow rate pressure and concentration risk.
02. Key Forces
Five forces that matter most from here
The first force is starting valuation. iShares SMI ETF (CH) showed 20.79x P/E, 3.99x P/B, and 2.58% trailing yield as of May 6, 2026. That matters because forward returns become more dependent on earnings delivery once a market is no longer cheap.
The second force is the latest macro mix. The Swiss CPI was 0.3% year on year in March 2026 and core inflation was 0.4%, according to the FSO. The latest official GDP print available in mid-May 2026 was Q4 2025 at +0.2% q/q; SECO forecast 2026 GDP growth at 1.0% and 2027 at 1.7%. That combination tells you whether the market is being helped by genuine growth, a better discount-rate backdrop, or neither.
The third force is index composition. Switzerland's blue-chip benchmark, defensive in character but still highly concentrated in healthcare and staples. When a benchmark leans heavily on a few sectors or companies, leadership breadth matters as much as the macro tape.
The fourth force is institutional conviction. Public strategy notes in 2026 show that broader European risk appetite has become more conditional, especially after the March energy shock. That raises the bar for any bull case built mainly on rerating.
The fifth force is time horizon. A one-year setup can look stretched while a longer-run cash-flow story still works. That is why the scenario map below ties each range to measurable triggers and review windows instead of pretending one number can summarize everything.
| Factor | Current assessment | Bias | Bullish trigger | Bearish trigger |
|---|---|---|---|---|
| Valuation proxy | 20.79x P/E and 3.99x P/B on May 6, 2026 | Bearish | Defensive earnings keep justifying the premium | Premium compresses with no earnings acceleration |
| Inflation regime | March 2026 CPI 0.3%, core 0.4% | Bullish | Low inflation keeps Swiss rates relatively benign | Imported inflation or franc weakness changes the setup |
| Growth outlook | SECO sees GDP growth of 1.0% in 2026 and 1.7% in 2027 | Neutral | External demand improves without harming defensives | Global slowdown hits exporters and pharmaceuticals together |
| Dividend support | UBS cited Swiss dividend yield around 3.2% when upgrading Swiss equities | Bullish | Yield support continues to attract defensive capital | Profit growth weakens enough to threaten payout confidence |
| Concentration | 20-stock index with limited technology breadth | Neutral | Healthcare and staples remain stable while cyclicals help | Defensives de-rate and there is no broader sector offset |
03. Countercase
What would break the thesis
The bear case starts with valuation and rates. If inflation remains sticky enough to keep real yields high, higher-quality or higher-beta equity markets lose room for multiple expansion quickly.
The second failure mode is earnings disappointment. These benchmarks can tolerate only so much macro noise if revisions stay supportive. Once revisions deteriorate while valuations are no longer cheap, downside scenarios get easier to trigger.
The third risk is concentration. Markets with large weights in banks, defensives, semis, or a few national champions can appear diversified at the headline level while still relying on a narrow earnings engine.
| Risk | Latest data point | Why it matters | What to monitor next |
|---|---|---|---|
| Premium multiple risk | 20.79x P/E and 3.99x P/B on May 6, 2026 | Leaves the market exposed if defensive growth disappoints | Valuation changes and earnings guidance |
| Weak external demand | Latest official GDP print only +0.2% q/q in Q4 2025 | Swiss exporters remain tied to global growth | SECO GDP releases and export data |
| Concentration shock | Small 20-name benchmark with limited tech exposure | Few stocks can dominate the index path | Large-cap healthcare and staples updates |
04. Institutional Lens
What verified institutional work actually adds
SMI is the only one of these four benchmarks where the public research reviewed offers a genuine named scenario frame. UBS published an upside December 2026 SMI scenario of 15,000 and a downside scenario of 10,500, then separately upgraded Swiss equities to Attractive in late March as it cut broader Europe.
That combination matters. It says strategists were not simply bearish Europe or bullish defensives in the abstract. They were explicitly rotating toward Switzerland's low-energy, dividend-rich, and healthcare-heavy profile during a more fragile macro phase.
| Institution / source | Updated | What it says | Why it matters here |
|---|---|---|---|
| UBS House View | January 30, 2026 | Upside SMI Dec. 2026 scenario at 15,000 and downside at 10,500 | One of the few public scenario maps specific to the Swiss benchmark |
| UBS CIO Daily | March 24-April 1, 2026 | Swiss equities upgraded to Attractive while Europe and eurozone were cut to Neutral | Shows strategists were paying for Switzerland's defensive quality and lower energy sensitivity |
| UBS Q&A | March 24, 2026 | Swiss dividend yield around 3.2% highlighted as part of the case | Useful anchor for why Swiss equities can keep attracting capital even without fast GDP growth |
| SECO | April 2026 | Swiss GDP growth forecast at 1.0% in 2026 and 1.7% in 2027 | Explains why the SMI bull case is usually a quality-compounding story rather than a domestic-cyclical boom |
05. Scenarios
Probability-weighted scenarios into 2030
The 2030 ranges below extend the current valuation and macro setup into a medium-term corridor. They are analytical ranges anchored in today's verified data and public strategy assumptions.
The base case remains the anchor because it asks for the least heroic assumptions. The bull case requires verified macro or earnings improvement. The bear case assumes valuation or concentration risk is no longer offset by hard data.
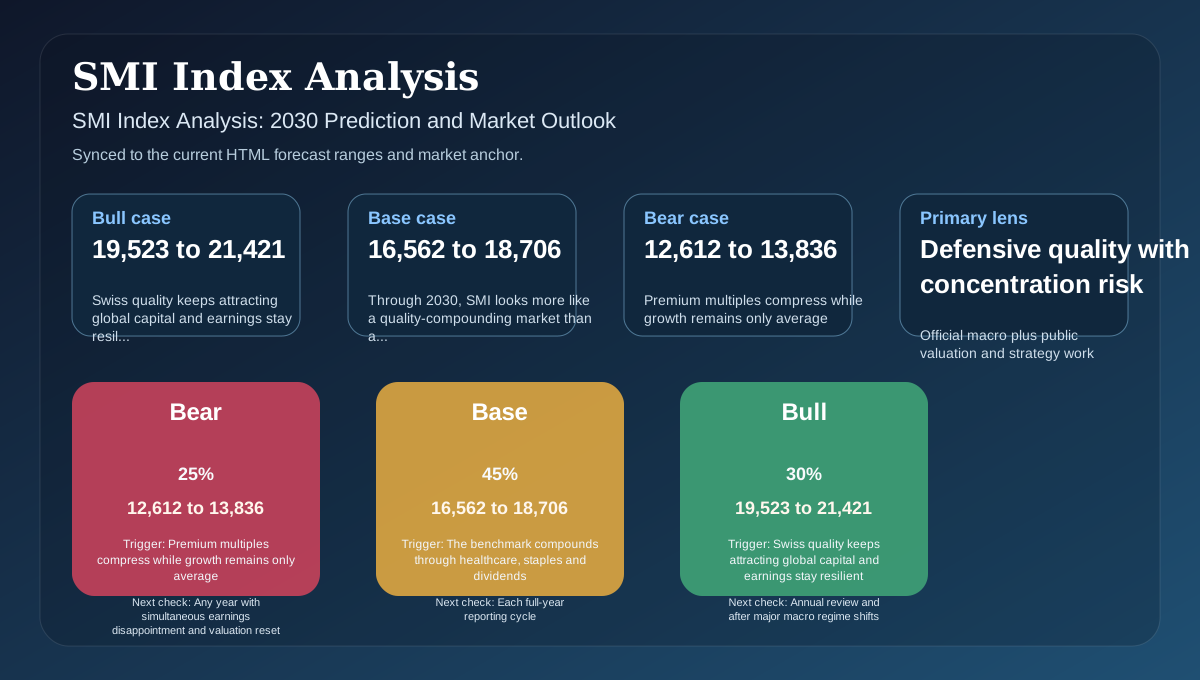
| Scenario | Probability | Working range | Measured trigger | Review window |
|---|---|---|---|---|
| Bull | 30% | 19,523 to 21,421 | Swiss quality keeps attracting global capital and earnings stay resilient | Annual review and after major macro regime shifts |
| Base | 45% | 16,562 to 18,706 | The benchmark compounds through healthcare, staples and dividends | Each full-year reporting cycle |
| Bear | 25% | 12,612 to 13,836 | Premium multiples compress while growth remains only average | Any year with simultaneous earnings disappointment and valuation reset |
These ranges are not there to create false precision. They are there to make the decision process testable. If the triggers fail to materialize, the probability mix should change rather than the analyst simply defending the old story.
For readers already positioned, the practical question is whether the market is still compounding through earnings or merely levitating on sentiment. For readers with no position, the cleaner entry is still the one confirmed by data, not by narrative comfort.
References
Sources
- SIX and BME April 2026 exchange figures
- iShares SMI ETF (CH) product page
- Swiss Federal Statistical Office CPI press release, March 2026
- SECO economic forecasts for Switzerland, April 2026
- UBS CIO monthly extended, January 30, 2026
- UBS CIO Daily, April 1, 2026
- UBS Q&A on Europe and Switzerland, March 24, 2026