01. Historical Context
The 2035 debate is about compounding quality, not short-term excitement
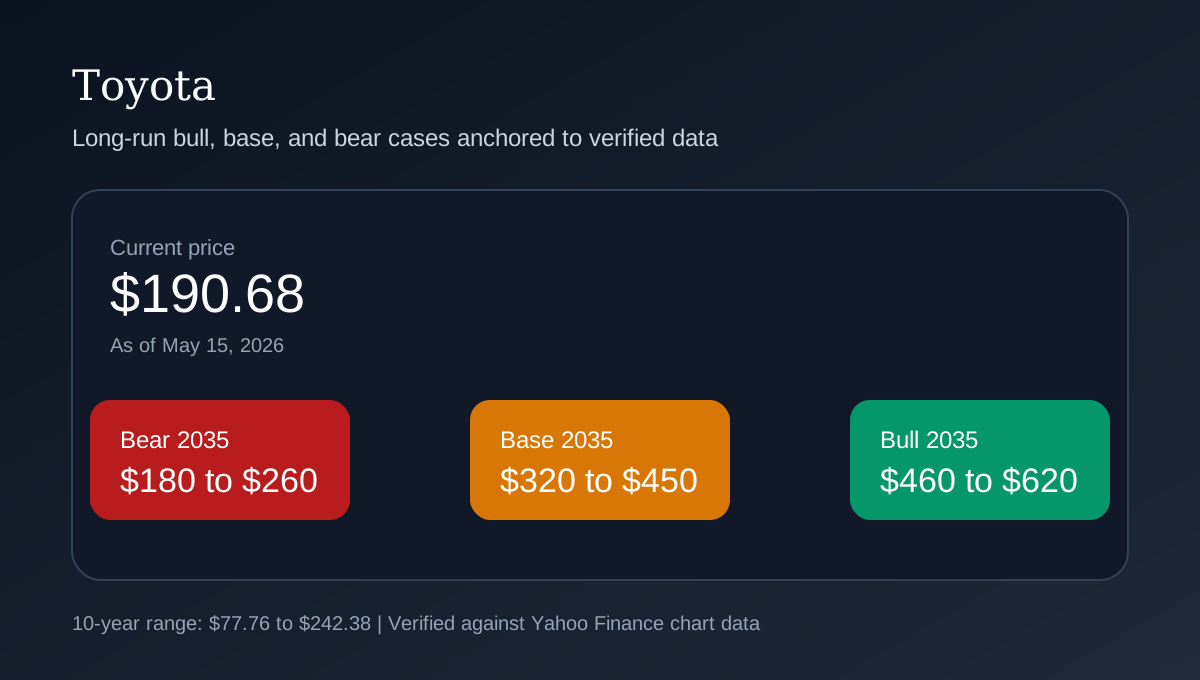
Toyota trades at $190.68 as of May 15, 2026. Over the last 10 years the ADR ranged from $77.76 to $242.38, so the stock has already proven it can compound, but it is now much closer to the upper end of that long-cycle range than to the floor.
The 10-year price history matters because it shows what this business or franchise has already been able to deliver through multiple macro regimes.
For a 2035 view, the biggest error is to extrapolate one good or bad year into a decade. The more durable method is to start from current price, current earnings power, balance-sheet posture, and structural industry position, then stress-test the valuation that would sit on top of those fundamentals.
| Horizon | What matters most | What would strengthen the thesis | What would weaken the thesis |
|---|---|---|---|
| 1-3 months | Price action versus $190.68 and the next guidance update | Revisions stabilize and the stock holds support | Price breaks support and revisions weaken |
| 6-18 months | Delivery against earnings guidance and margin resilience | Revenue and profit stay within management guidance bands | Guidance is cut or key segments miss |
| To 2035 | Capital allocation, valuation, and industry structure | Execution compounds and valuation stays disciplined | The thesis becomes too dependent on multiple expansion alone |
02. Key Forces
The structural variables that will decide the 2035 outcome
Yahoo Finance showed a trailing P/E of 10.19x, TTM EPS of $18.71, and a one-year target estimate of $256.52.
The bull case is still credible because Toyota retains scale, hybrid demand remains resilient, and the stock is not priced like a high-growth glamour asset.
The bear case is also real because the FY2027 operating-income guide of yen 3.0 trillion is roughly 20% below FY2026 actual operating income.
The institutional takeaway is straightforward. IMF staff said on April 3, 2026 that Japan growth should moderate to 0.8% in 2026 and that inflation, after printing 1.3% year over year in February, is expected to rise during 2026 before converging back toward the BOJ target in 2027. That matters for Toyota because a slower external backdrop and tighter trade conditions reduce the room for multiple expansion, even while domestic policy normalization remains gradual.
Long-term returns also depend on whether the starting multiple leaves room for disappointment. Even strong businesses can produce only moderate decade-long returns if bought after most of the rerating has already happened.
| Factor | Why it matters | Current assessment | Bias | What would change it |
|---|---|---|---|---|
| Valuation | Trailing P/E 10.19x; forward P/E 10.04x | Still investable, but less forgiving if execution slips | Neutral to bull | A cheaper entry or faster earnings growth would improve it |
| Earnings setup | TTM EPS $18.71; 1-year target estimate $256.52 | Upside exists, but the target needs earnings delivery to close the gap | Neutral | Upward estimate revisions would turn this more bullish |
| Macro | IMF sees Japan growth slowing to 0.8% in 2026, while the BOJ is still normalizing policy. | Japan is still growing, but the corridor is narrower than in 2024 | Neutral | A cleaner growth and inflation mix would help |
| 10-year trend | Range $77.76 to $242.38; total return about 145% | Long-run compounding is proven, so the debate is about entry and slope | Bull | A break below long-cycle support would weaken that read |
| Catalysts | Earnings, guidance, capital return, and policy | Plenty of review points remain on the calendar | Neutral | A positive guidance revision or a policy surprise would matter |
03. Countercase
What would pull the 2035 range down
Reuters reported on May 8, 2026 that Toyota estimated tariffs would cost yen 180 billion in April and May alone, while currency movement represented a much larger yen 745 billion drag in the full-year outlook.
The next risk is structural dilution of the core story. That can mean weaker pricing power, higher capital intensity, slower mix improvement, or a more crowded competitive field.
The third risk is that a decade that begins with low-double-digit or mid-teen multiples still ends with little multiple support because investors no longer view the business as scarce or improving.
| Risk | Latest data point | Current assessment | Bias |
|---|---|---|---|
| Valuation reset | Trailing P/E 10.19x | Not expensive enough to panic, but no longer gives a free pass | Neutral |
| Guidance risk | Near-term guidance sets the first leg of the long-run compounding curve. | The next 12 months matter because management has already set a clear bar | Bearish if missed |
| Macro slowdown | The IMF macro corridor is still positive, but not immune to a shock. | A softer Japan or global demand backdrop would pressure multiples and estimates | Neutral to bear |
| Narrative fatigue | The longer the horizon, the more capital discipline matters. | If the story stops improving, the stock can de-rate even with okay results | Neutral |
04. Institutional Lens
Institutional lens for a decade-long forecast
The institutional takeaway is straightforward. IMF staff said on April 3, 2026 that Japan growth should moderate to 0.8% in 2026 and that inflation, after printing 1.3% year over year in February, is expected to rise during 2026 before converging back toward the BOJ target in 2027. That matters for Toyota because a slower external backdrop and tighter trade conditions reduce the room for multiple expansion, even while domestic policy normalization remains gradual.
Serious long-horizon work is less about copying a bank target and more about testing what level of earnings and what range of multiples could plausibly coexist in 2035.
That is why the 2035 output here is explicitly a bull, base, and bear range with probabilities rather than a fabricated point estimate.
| Source | What it said | Why it matters here | Updated |
|---|---|---|---|
| Company filings | Toyota reported FY2026 revenue of yen 50.684 trillion, up 5.5%, but operating income fell to yen 3.766 trillion from yen 4.796 trillion and net income attributable to shareholders fell to yen 3.848 trillion. Management guided FY2027 revenue of yen 51.0 trillion, operating income of yen 3.0 trillion, and net income of yen 3.0 trillion. | This is the anchor for the operating case | May 15, 2026 |
| IMF Japan Article IV | The institutional takeaway is straightforward. IMF staff said on April 3, 2026 that Japan growth should moderate to 0.8% in 2026 and that inflation, after printing 1.3% year over year in February, is expected to rise during 2026 before converging back toward the BOJ target in 2027. That matters for Toyota because a slower external backdrop and tighter trade conditions reduce the room for multiple expansion, even while domestic policy normalization remains gradual. | Defines the macro corridor that should frame valuation | April 3, 2026 |
| Bank of Japan | The BOJ continued policy normalization in 2026 instead of returning to emergency settings. | Critical for discount rates and bank or exporter sentiment in Japan | 2026 releases |
| Yahoo Finance | Live quote pages showed price $190.68, TTM EPS $18.71, and long-run price history. | Useful for valuation framing and long-cycle context | May 15, 2026 |
05. Scenarios
2035 scenarios and the conditions behind them
The 2035 ranges below are editorial scenarios built from today's price, the verified 10-year history, and the latest public company data.
The right habit is to revisit the range after every major cycle break: recession, policy regime shift, or structural change in the business model.
| Scenario | Probability | Trigger and target range | Review point |
|---|---|---|---|
| Bull case | 20% | The business compounds cleanly for years and retains enough scarcity for the market to pay a respectable multiple; target range $460 to $620 | Re-check after each major macro regime change and every annual result cycle |
| Base case | 50% | Earnings grow at a normal pace and the valuation roughly holds; target range $320 to $450 | Re-check after each major macro regime change and every annual result cycle |
| Bear case | 30% | Growth disappoints, capital intensity rises, or the valuation compresses across the cycle; target range $180 to $260 | Re-check after each major macro regime change and every annual result cycle |
References
Sources
- Yahoo Finance quote page for TM, crawled May 15, 2026
- Yahoo Finance 10-year chart endpoint for TM
- Toyota FY2026 results release, published May 8, 2026
- Toyota FY2026 press briefing page, published May 8, 2026
- Reuters on Toyota tariffs and FY2027 guidance, published May 8, 2026
- IMF Article IV for Japan, published April 3, 2026
- Bank of Japan statements on monetary policy, 2026 releases