01. Historical Context
DXY is a macro price, not a corporate valuation story
DXY is administered by ICE and calculated from six currencies with fixed weights: euro 57.6%, yen 13.6%, pound 11.9%, Canadian dollar 9.1%, Swedish krona 4.2%, and Swiss franc 3.6%. Because it is a currency index, metrics such as forward P/E, trailing P/E, EPS, and EPS growth are not available and should not be invented.
| Horizon | What matters most | What would strengthen the thesis | What would weaken the thesis |
|---|---|---|---|
| 2026-2027 | Inflation, Fed path, and euro sensitivity | Sticky U.S. inflation and shallow easing | Faster disinflation and earlier cuts |
| 2028-2029 | Relative growth and capital flows | U.S. productivity outperforms major peers | Growth leadership rotates away from the U.S. |
| To 2030 | Structural demand for U.S. assets | Wider rate differentials and stronger private capital inflows | Persistent dollar softening versus the euro and yen |
Yahoo Finance chart data show DXY's latest close at 99.27, a 2026 low close of 96.22 on January 27, 2026, and a 2026 high close of 100.51 on March 30, 2026. That is an important starting point: the index is no longer priced like a crisis hedge, but it is not yet in a deep structural downtrend either.
Long-range forecasting therefore needs to focus on policy and regime change. A currency basket can spend years moving sideways in nominal terms while delivering very different macro messages underneath.
02. Key Forces
Five forces that matter most for the path to 2030
First is inflation persistence. April 2026 CPI was 3.8% year over year and March 2026 PCE was 3.5%, both still above the Fed's target. That leaves room for the dollar to stay supported in the short run even if the medium-term direction softens.
Second is the Fed's projected easing path. The March 2026 Summary of Economic Projections showed median year-end 2026 and 2027 fed funds rates of 3.4% and 3.1%, respectively, after an April 29 decision to keep the current target at 3.50%-3.75%. That trajectory implies lower U.S. carry by the end of the decade, but not a collapse in rate support.
Third is growth. BEA's advance estimate showed Q1 2026 GDP up 2.0% annualized and private domestic final sales up 2.5%, while IMF sees global growth at 3.1% in 2026 and 3.2% in 2027. If the U.S. continues to grow faster than Europe and Japan, DXY can remain closer to the top of its long-term band.
Fourth is institutional asset demand. Goldman Sachs says the dollar should continue weakening in 2026 as demand for U.S. assets diminishes. J.P. Morgan Asset Management's long-term assumptions project 0.6% annualized dollar weakening versus the euro, which points to a lower terminal DXY unless U.S. growth keeps overpowering that trend.
Fifth is productivity and technology. Goldman forecasts U.S. potential GDP growth at about 2.1% in 2025-2029 and 2.3% in the early 2030s as AI boosts growth further. If that productivity uplift stays U.S.-centric, the 2030 bull case remains live; if it diffuses globally, DXY's relative advantage narrows.
| Factor | Current Assessment | Bias | What to monitor |
|---|---|---|---|
| Inflation | CPI 3.8%, core CPI 2.8%, PCE 3.5%, core PCE 3.2% | Mild bull | Whether core PCE holds above 2.5% |
| Fed path | Current target 3.50%-3.75%; median 3.1% by end-2027 | Neutral | Depth and pace of cuts through 2027 |
| U.S. growth premium | Q1 2026 GDP 2.0%; Goldman sees 2.6% U.S. growth in 2026 | Neutral to bull | Whether Europe and Japan close the gap |
| Institutional dollar view | Goldman and J.P. Morgan lean weaker USD over time | Mild bear | Changes in capital-flow and reserve narratives |
| Productivity / AI | Potential support if U.S. productivity remains ahead | Neutral | Whether AI lifts U.S. growth more than peer growth |
That mix does not support a high-conviction secular breakout. It supports a broader range in which the dollar stays credible but loses some of its post-2022 exceptionalism.
03. Countercase
What would break the long-term range and push DXY lower
The most credible downside path is a combination of easier Fed policy and better relative growth outside the U.S. If core PCE trends closer to the Fed's 2.2% 2027 median and Europe benefits from cyclical stabilization, DXY can move into the low 90s without requiring a U.S. recession.
A second risk is that long-term U.S. asset demand cools. Goldman explicitly links its softer-dollar view to diminished demand for U.S. assets, while J.P. Morgan's long-term framework already assumes dollar weakness against the euro. A multi-year DXY bear market does not need a domestic crisis; it only needs a smaller U.S. premium.
The third risk is basket concentration. Because the euro dominates DXY, a better euro outlook or a weaker dollar-versus-euro trend can do disproportionate work. That concentration argues for caution when making dramatic multi-year DXY calls from U.S.-only data.
| Risk | Current Assessment | Why it matters | Bias |
|---|---|---|---|
| Faster Fed easing | March SEP already points to 3.1% by end-2027 | Less carry usually weakens the dollar | Neutral to bear |
| Global catch-up growth | IMF sees moderate world growth, not collapse | Smaller U.S. growth premium compresses DXY | Neutral |
| Long-term flow reversal | Goldman and J.P. Morgan already lean softer USD | Institutional demand sets the multi-year trend | Mild bear |
| Mean reversion | Still below the 112.12 monthly peak from 2022 | Past extremes are far from the current level | Neutral |
The low-90s bear case becomes much more credible if DXY spends several quarters below 96 while the Fed is cutting and euro-area growth data are no longer deteriorating.
04. Institutional Lens
How official and institutional views shape the 2030 corridor
Fed projections are still too restrictive for a dollar-collapse thesis. In March 2026, policymakers' medians were 2.4% GDP growth, 2.7% PCE inflation, 2.7% core PCE inflation, and a 3.4% fed funds rate for 2026. That is consistent with a slowing but still supported dollar.
Goldman Sachs' 2026 outlook combines sturdy U.S. growth with a weaker-dollar view. The firm expects the dollar to continue weakening in 2026, sees the U.S. economy growing 2.6%, and expects core PCE inflation to fall to 2.2% by December 2026. That is not a recession narrative; it is a narrowing U.S. premium narrative.
J.P. Morgan Asset Management's 2026 Long-Term Capital Market Assumptions project the dollar weakening 0.6% annualized versus the euro over its horizon. IMF's April 2026 WEO projects only moderate global growth and warns about downside geopolitical risks. Together, those sources support a 2030 outlook of gradual softening with periodic dollar rebounds rather than a straight line in either direction.
| Source | Updated | What it says | 2030 implication |
|---|---|---|---|
| Federal Reserve | March 18 and April 29, 2026 | Current target 3.50%-3.75%; median policy rate 3.1% by end-2027 | Supports range trading, not collapse |
| Goldman Sachs | March 2026 and 2026 outlooks | Dollar to keep weakening in 2026; U.S. GDP 2.6%; core PCE 2.2% by Dec. 2026 | Gradual dollar softening if disinflation continues |
| J.P. Morgan Asset Management | 2026 LTCMA | Dollar weakening 0.6% annualized versus euro over forecast horizon | Long-run drag on DXY |
| IMF | April 2026 WEO | World growth 3.1% in 2026, 3.2% in 2027; downside risks dominate | Volatility remains high and dollar spikes stay possible |
That combination justifies a wide 2030 corridor, but it does not justify presenting a one-number target as if it were precise.
05. Scenarios
A practical 2030 scenario map
The most useful way to forecast DXY to 2030 is to pair each range with a trigger and a review calendar.
| Scenario | Probability | Target range | Trigger conditions | Review schedule |
|---|---|---|---|---|
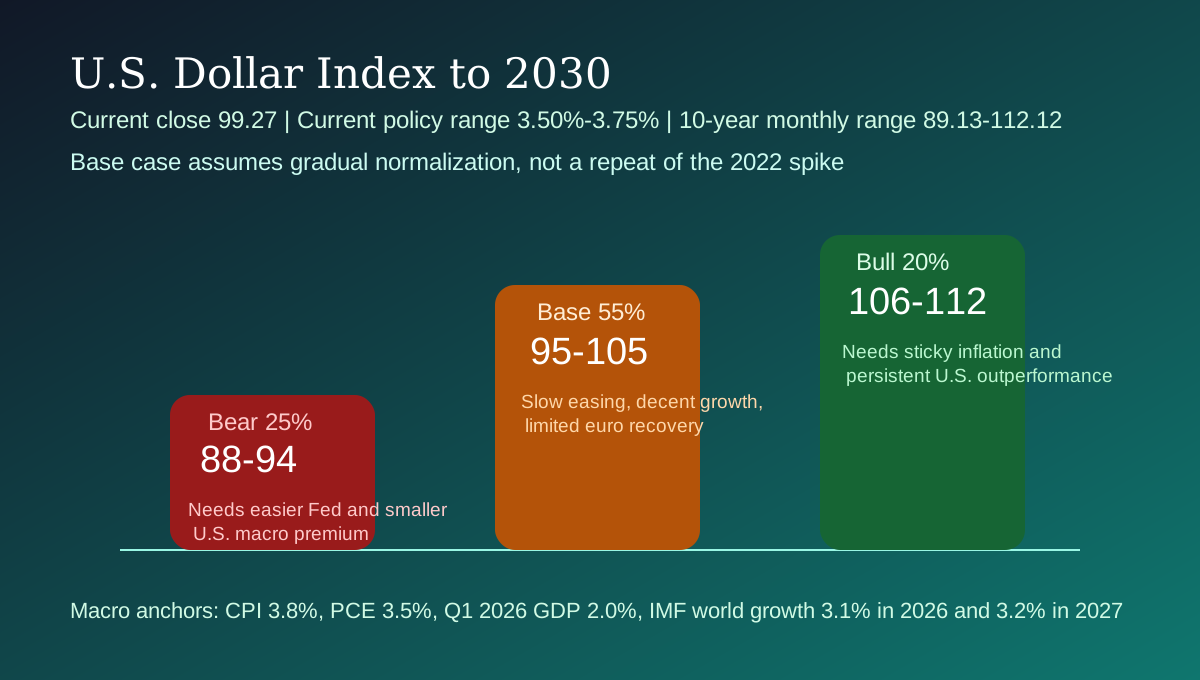
| Base case | 55% | 95-105 | Fed normalizes slowly, U.S. growth stays decent, euro strengthens only in bursts | Review after each March and December SEP |
| Bull case | 20% | 106-112 | Inflation proves sticky, real yields stay high, and Europe or Japan disappoints repeatedly | Reassess after two consecutive upside inflation surprises |
| Bear case | 25% | 88-94 | Fed cuts more deeply, euro-area growth stabilizes, and U.S. asset demand cools | Reassess if DXY trades below 96 for multiple quarters |
A move above the 2022 monthly closing high of 112.12 by 2030 would require more than sticky inflation. It would likely need another period of global stress plus a fresh widening in U.S. policy or growth differentials. A move into the high 80s would require the opposite: enduring dollar softening against the euro and a visibly smaller U.S. macro premium.
For most investors, the right takeaway is that DXY remains a regime indicator more than a pure trend asset. The thesis should be re-underwritten with every material shift in inflation, Fed guidance, and euro-area growth.
References
Sources
- Yahoo Finance chart data for U.S. Dollar Index (10-year monthly series)
- ICE U.S. Dollar Index overview
- ICE FX Indexes methodology
- BLS Consumer Price Index, April 2026
- BEA Personal Income and Outlays, March 2026
- BEA GDP Advance Estimate, 1st Quarter 2026
- Federal Reserve FOMC statement, April 29, 2026
- Federal Reserve Summary of Economic Projections, March 18, 2026
- IMF World Economic Outlook, April 2026
- Goldman Sachs 2026 outlooks page
- Goldman Sachs forecasts for the world's biggest economies in 2026
- Goldman Sachs on U.S. potential growth and AI productivity
- J.P. Morgan Asset Management 2026 Long-Term Capital Market Assumptions