01. Historical Context
The bearish setup matters because the FTSE MIB still trades like a strong market, not like a washed-out one
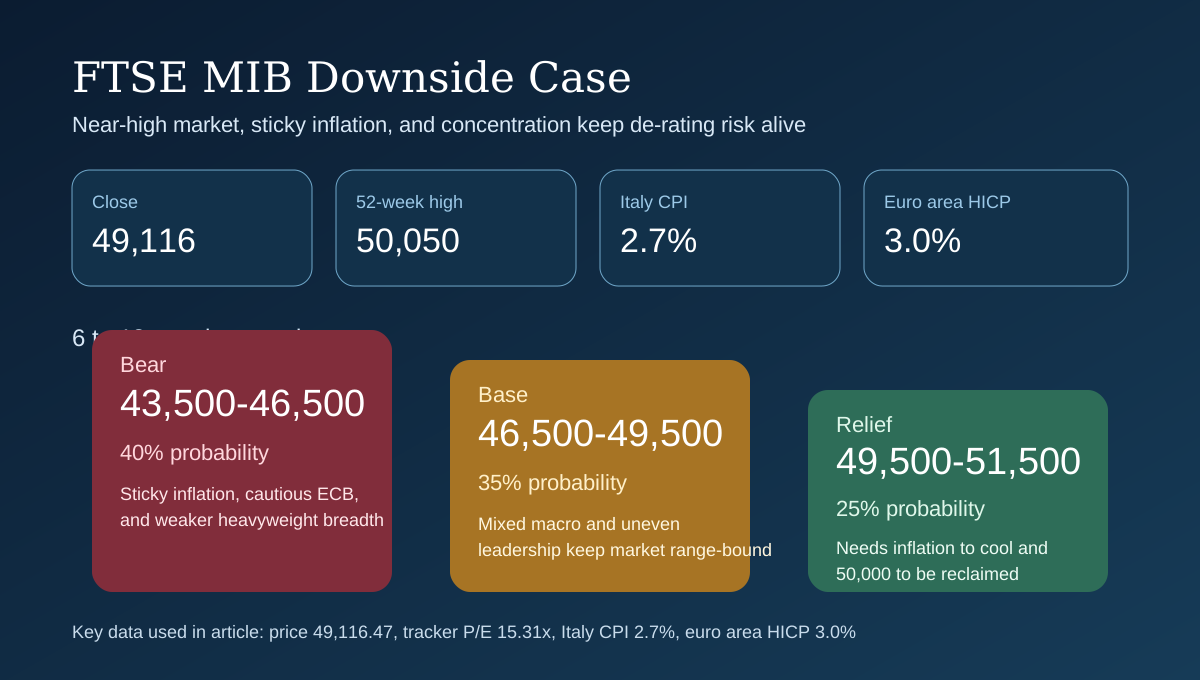
Yahoo Finance data show the FTSE MIB at 49,116.47 on 15 May 2026 versus a 52-week high of 50,050.00 and a 31 December 2025 close of 45,527.00. That means the benchmark has had a powerful run and remains near its peak. Downside analysis is more relevant in that situation because bad news does not need to hit a panicked market to create losses. It only needs to convince investors that the same earnings stream deserves a lower multiple.
| Horizon | What matters most | What would strengthen the thesis | What would weaken the thesis |
|---|---|---|---|
| 1-3 months | Inflation, ECB language, and price action around 50,000 | The index fails near the high and loses 47,500 while inflation stays firm | Inflation cools quickly and the index reclaims 50,000 |
| 6-12 months | Whether bank-heavy earnings breadth narrows | European EPS revisions soften and the major Italian financials stop outperforming | UniCredit, Intesa, Enel, Leonardo, and Prysmian keep delivering enough to absorb macro pressure |
| To 2027 | Whether modest growth can still justify current multiples | Domestic demand remains weak and valuation support erodes | Italy and the euro area remain slow but resilient, keeping the de-rating shallow |
Public valuation data are not screaming distress. BlackRock's iShares FTSE MIB UCITS ETF showed a holdings P/E ratio of 15.31, a price-to-book ratio of 2.05, and a 12-month trailing dividend distribution yield of 3.44 as of 14 May 2026. Those are still reasonable figures for a constructive market. They do not look like a benchmark where disappointment is already fully priced.
Concentration increases the downside sensitivity. The same live tracker showed 40 holdings and a top-ten weight of 70.72%. Financials were 46.97% of the benchmark. UniCredit alone was 14.97%, Intesa Sanpaolo 12.43%, and Enel 10.47%, meaning those three stocks together represented 37.87% of the benchmark. In a structure like that, a few leadership reversals can translate into index-level weakness quickly.
02. Key Forces
Five bearish forces that could push the trend lower
First, the inflation backdrop deteriorated in April. Istat said on 15 May 2026 that Italy's CPI accelerated to 2.7% year on year from 1.7% in March, while HICP rose to 2.8% from 1.6%. The acceleration was driven by non-regulated energy prices moving from -2.0% to +9.6%, regulated energy from -1.6% to +5.3%, and unprocessed food from +4.7% to +5.9%. That matters because a market near its high rarely welcomes a new inflation scare.
Second, euro area inflation is also moving the wrong way. Eurostat's 30 April 2026 flash estimate put euro area HICP at 3.0%, up from 2.6% in March, with energy inflation jumping to 10.9%. The ECB responded by leaving its key rates unchanged on 30 April 2026. A bank-heavy benchmark like the FTSE MIB can benefit from high rates for a while, but once inflation starts challenging the broader equity multiple, the support fades.
Third, the market is not cheap enough to absorb repeated misses easily. Goldman Sachs Research said on 15 January 2026 that Europe traded at 15x 2026 earnings and around the 70th percentile of its own 25-year history. That fits well with the FTSE MIB tracker's 15.31x trailing P/E. If Europe-wide profit expectations soften, the market can fall even without a sharp drop in actual profits simply because investors stop accepting the current multiple.
Fourth, not every important constituent is firing at full power. Enel's Q1 2026 results showed ordinary EBITDA of EUR 6.003 billion, up only 0.5% year over year, while ordinary group net income was EUR 1.941 billion, down 3.1%. STMicroelectronics reported Q1 net revenues of USD 3.10 billion, operating income of USD 70 million, and net income of USD 37 million, even while it remained constructive on datacenter revenue. Stellantis reported Q1 2026 net revenues of EUR 38.1 billion, but its adjusted operating income margin was still only 2.5% and industrial free cash flow was negative EUR 1.9 billion. Those are not collapse signals, but they are not broad-based acceleration signals either.
Fifth, the domestic macro picture is decent but not strong enough to rescue a de-rating by itself. Istat's Q1 2026 GDP release showed that Italy grew 0.2% quarter on quarter and 0.7% year on year, but the quarterly increase came from services and net exports while the domestic component excluding inventories was negative. Eurostat's flash estimate showed euro area GDP up only 0.1% in Q1 2026. That is a soft enough backdrop to make the index vulnerable if leadership cracks.
| Factor | Why it matters | Current assessment | Bias |
|---|---|---|---|
| Inflation and rates | Drives the market's willingness to pay current multiples | Italy CPI is 2.7%, euro area HICP is 3.0%, and the ECB is on hold | Bearish |
| Valuation | Determines how much disappointment can be absorbed | Goldman says Europe is at 15x 2026 P/E; FTSE MIB tracker is 15.31x trailing P/E | Neutral to bearish |
| Concentration | Turns stock-specific weakness into index weakness | Financials are 46.97% of the benchmark and the top ten are 70.72% | Bearish |
| Earnings breadth | Separates a pause from a broader de-rating | Banks and some industrials are strong, but Enel, ST, and Stellantis show that delivery is not universally accelerating | Neutral |
| Macro growth | Sets the margin for error if leadership weakens | Italy GDP grew 0.2% qoq and euro area GDP 0.1% qoq in Q1 2026 | Neutral to bearish |
The downside case therefore does not need a dramatic accident. It only needs sticky inflation, narrow leadership, and less tolerance for current multiples.
03. Countercase
What could stop the decline from becoming a larger problem
The strongest counterargument is that the benchmark's leaders are still delivering. UniCredit reported record first-quarter net profit of EUR 3.2 billion, up 16% year over year. Intesa Sanpaolo reported net income of EUR 2.8 billion, up 5.6%. That is a meaningful offset because those two banks together represent 27.40% of the tracker. A bearish case is less compelling if the leadership group remains fundamentally strong.
The second counterpoint is that industrial and defence breadth is not weak. Leonardo's new orders rose 31% year over year to EUR 9 billion in Q1 2026, while Prysmian's Digital Solutions adjusted EBITDA more than doubled to EUR 88 million. Those are real earnings-quality supports inside important parts of the index.
The third counterpoint is that Italy is not in recession. Unemployment is 5.2%, euro area GDP is still positive, and Europe-wide EPS revisions have recently turned up. That makes the bearish case more about valuation compression and leadership fatigue than about an immediate macro collapse.
| Offset | Latest data point | Why it matters | Current assessment |
|---|---|---|---|
| Bank profitability | UniCredit net profit EUR 3.2 billion and Intesa net income EUR 2.8 billion in Q1 2026 | The two largest financial weights are still delivering | Bullish offset |
| Industrial breadth | Leonardo orders EUR 9 billion and Prysmian Digital Solutions EBITDA EUR 88 million | Shows that upside is not limited to banks | Bullish offset |
| Labor market | Italy unemployment 5.2% and employment rate 62.4% | Suggests the macro backdrop is soft, not broken | Neutral to bullish offset |
| Europe revisions | J.P. Morgan says Europe 2026 EPS revisions have turned positive after seven negative months | Reduces the probability of a deep earnings-led selloff | Neutral to bullish offset |
| Institutional base case | Goldman still expects an 8% STOXX 600 total return in 2026 | Professional strategy remains constructive unless earnings or inflation data worsen | Neutral offset |
The bearish case becomes much stronger only if these offsets fade together. Without that confirmation, the more likely downside path is a grind lower or a volatile range, not a straight collapse.
04. Institutional Lens
How professional investors frame the downside risk
Goldman Sachs Research is useful here precisely because it is constructive, not bearish. On 15 January 2026 the firm said it expected an 8% total return for the STOXX 600 in 2026, with 5% EPS growth in 2026 and 7% in 2027, even though Europe was already trading at 15x 2026 earnings and around the 71st percentile of the last 25 years. The read-through is that downside in European equities is most likely to come from earnings or inflation failing to validate an already respectable valuation base.
J.P. Morgan Asset Management is making a similarly conditional call. Its 2026 global ex-US outlook says Europe's 2026 EPS estimate is now being revised up after seven negative months, but it also says mid-single-digit growth is more realistic than the 12% implied by bottom-up forecasts. If that more conservative profit path slips, a benchmark like the FTSE MIB can de-rate even if the macro data stay merely sluggish rather than disastrous.
The ECB remains the live policy check. On 30 April 2026 it kept rates unchanged and reiterated a data-dependent, meeting-by-meeting approach. That means each inflation release still matters for downside analysis more than a static year-ahead narrative does.
| Source | What it said | Date | Read-through for FTSE MIB |
|---|---|---|---|
| Goldman Sachs Research | STOXX 600 total return forecast of 8% in 2026, but Europe already trades at 15x 2026 P/E and in the 71st percentile of history | 15 January 2026 | If profits disappoint, the valuation cushion is limited |
| Goldman Sachs Research | STOXX 600 EPS growth forecast of 5% in 2026 and 7% in 2027 | 15 January 2026 | Any failure to hit those numbers would weaken the bullish regional backdrop |
| J.P. Morgan Asset Management | Europe's 2026 EPS revisions turned positive after seven negative months, but mid-single-digit growth is more realistic than 12% | 2026 outlook page available in May 2026 | Downside extends if even the more conservative earnings path begins to slip |
| J.P. Morgan Asset Management | Europe ex-UK trades around 16x forward earnings and European banks at about 1.1x book with 8% shareholder yield | 2026 outlook page available in May 2026 | The FTSE MIB remains attractive only as long as bank profitability holds up |
| ECB | The Governing Council kept key rates unchanged and remains data dependent | 30 April 2026 | Explains why inflation data can still drive a de-rating even without a recession |
The institutional message is therefore simple: the FTSE MIB can fall further, but the mechanism is most likely valuation compression and narrower breadth, not an immediate macro collapse.
05. Scenarios
Actionable downside scenarios over the next 6 to 12 months
The ranges below are author estimates built from the current FTSE MIB level, current valuation, sector concentration, Italy and euro area inflation data, and the institutional research cited above. They are not third-party price targets.
| Scenario | Probability | Range | Trigger conditions | When to review |
|---|---|---|---|---|
| Bear | 40% | 43,500-46,500 | The index loses 47,500 on a sustained weekly basis, Italy CPI remains above 2.5%, euro area HICP stays near or above 3.0%, the ECB stays cautious, and at least one major bank or industrial heavyweight weakens guidance | Review after the 20 May 2026 Eurostat April HICP detail, the 29 May 2026 Istat inflation and labor releases, the 11 June 2026 ECB decision, and the late-July reporting window |
| Base | 35% | 46,500-49,500 | Growth stays soft but positive, bank leadership offsets part of the pressure, and the benchmark oscillates below the high without a decisive break lower | Review monthly with inflation, labor, and GDP data, and again after each major constituent update |
| Relief rally | 25% | 49,500-51,500 | Inflation cools quickly, Europe-wide revisions stay positive, and the index reclaims 50,000 with broader participation | Review if the FTSE MIB closes back above 50,000 and holds that level through an earnings cycle |
The tactical conclusion is that sellers still need confirmation, but the setup is not benign enough to dismiss. A market near its high with current concentration and current inflation data still has room to de-rate.
For holders, risk control matters more than calling the exact top. The bearish case is strongest only if inflation, concentration, and weakening breadth start compounding rather than merely coexisting.
References
Sources
- Yahoo Finance chart API for FTSE MIB 10-year monthly history
- Yahoo Finance chart API for FTSE MIB latest daily price metadata
- iShares FTSE MIB UCITS ETF product page
- iShares FTSE MIB detailed holdings and analytics export
- Istat: preliminary estimate of GDP - Q1 2026
- Istat: employment and unemployment - March 2026
- Istat: consumer prices - April 2026
- Eurostat: euro area annual inflation up to 3.0% in April 2026
- Eurostat: euro area GDP and employment flash estimate for Q1 2026
- ECB monetary policy decision, 30 April 2026
- ECB Governing Council meeting calendar
- Goldman Sachs Research: European stocks outlook, 15 January 2026
- J.P. Morgan Asset Management: global ex-US equities outlook
- UniCredit 1Q26 group results
- Intesa Sanpaolo consolidated results as at 31 March 2026
- Enel Q1 2026 results
- STMicroelectronics Q1 2026 financial results
- Stellantis first quarter 2026 financial results
- Leonardo 1Q2026 results
- Prysmian Q1 2026 results