01. Historical Context
Why the current setup can still support more upside
Shenzhen Index currently sits at around 13,700 in early April 2026. The valuation anchor is 29.92x average P/E in the April 3, 2026 SZSE bulletin, down from 33.59x in the March 6, 2026 bulletin, and that is the first fact that should shape any forecast. A long-horizon article is only useful if it starts from the present setup rather than treating valuation as an afterthought.
| Horizon | What matters most | What would strengthen the thesis | What would weaken the thesis |
|---|---|---|---|
| 1-3 months | Price action versus revisions | Better breadth, calmer macro headlines, stable valuation | Narrow leadership, higher yields, weaker guidance |
| 6-18 months | Earnings delivery and policy transmission | Positive revisions and better domestic demand | Negative revisions, tighter liquidity, growth disappointment |
| To 2030 | Sustainable profitability and multiple discipline | Earnings compounding without a valuation blowout | Repeated de-rating, stalled profits, or structural policy drag |
China's GDP rose 5.0% in Q1 2026 and CPI rose 1.2% in April 2026, but the domestic-demand split remains uneven and real-estate investment is still contracting. The IMF's April 2026 regional work still framed Asia as the global growth leader, but emphasized that higher energy costs and geopolitical shocks are narrowing policy room. For Shenzhen Index, that macro corridor means the next cycle is likely to be driven less by storytelling and more by how earnings absorb rates, energy and policy shocks.
That is why the relevant question is not whether Shenzhen Index can print an attention-grabbing number by 2030. The relevant question is which combination of earnings, valuation and liquidity would justify paying more than today. Shenzhen's most active names in the official spring bulletins were optical-link and solar-related companies, which captures the market's ongoing bias toward AI infrastructure and power-electronics themes.
02. Key Forces
Five measurable forces that could extend the rally
The upside case starts with valuation room. 29.92x average P/E in the April 3, 2026 SZSE bulletin, down from 33.59x in the March 6, 2026 bulletin USD 6.25 trillion of market capitalization and 3.38 average turnover ratio in the April 3, 2026 SZSE bulletin. That is not cheap enough to ignore execution, but it is also not so stretched that the bull case is mathematically closed.
Macro is the second control variable. China's GDP rose 5.0% in Q1 2026 and CPI rose 1.2% in April 2026, but the domestic-demand split remains uneven and real-estate investment is still contracting. Markets can carry elevated multiples for longer when inflation is falling or contained, but not when the discount rate is rising faster than earnings.
Earnings and revisions are the third control variable. The strongest markets are the ones where analyst numbers stop falling before price leadership gets crowded. That matters especially for Shenzhen Index, because one-way narratives tend to break when estimate revisions do not confirm them.
Policy transmission is the fourth control variable. Shenzhen's most active names in the official spring bulletins were optical-link and solar-related companies, which captures the market's ongoing bias toward AI infrastructure and power-electronics themes. For this index, the real issue is whether macro support reaches profits, credit growth, domestic demand or export volumes quickly enough to justify the next leg.
Positioning and breadth are the fifth control variable. A market can stay expensive longer than skeptics expect, but rallies driven by a small group of names are less durable than rallies confirmed by wider participation and sector rotation.
| Factor | Current assessment | Bullish read | Bearish read | Bias |
|---|---|---|---|---|
| Macro | The growth backdrop is improving, but Shenzhen still trades like a high-beta expression of policy and liquidity. | Improving revisions, cleaner macro and valuation support | Revisions roll over or the multiple stops being supported | Neutral |
| Valuation | A near-30x average P/E leaves less room for disappointment than Shanghai. | Improving revisions, cleaner macro and valuation support | Revisions roll over or the multiple stops being supported | Bearish |
| Sector mix | Growth hardware, optics and renewables keep upside leverage high when revisions improve. | Improving revisions, cleaner macro and valuation support | Revisions roll over or the multiple stops being supported | Bullish |
| Liquidity | Turnover remains strong, which helps rallies, but it can also magnify drawdowns. | Improving revisions, cleaner macro and valuation support | Revisions roll over or the multiple stops being supported | Neutral |
| Policy | Shenzhen needs follow-through in credit, consumption and industrial policy to justify premium multiples. | Improving revisions, cleaner macro and valuation support | Revisions roll over or the multiple stops being supported | Neutral |
The point of this table is not to force certainty. It is to show where the current balance of evidence leans today, not where a narrative would like it to lean.
03. Countercase
What would interrupt the bullish path
The simplest way to break the thesis is to let the market trade above the evidence. 29.92x average P/E in the April 3, 2026 SZSE bulletin, down from 33.59x in the March 6, 2026 bulletin means the next disappointment would matter more if earnings revisions stall or reverse.
A second risk is macro slippage. China's GDP rose 5.0% in Q1 2026 and CPI rose 1.2% in April 2026, but the domestic-demand split remains uneven and real-estate investment is still contracting. If inflation or oil shocks force tighter financial conditions, the market will demand more proof from cyclical and duration-sensitive sectors.
A third risk is narrow leadership. Index-level performance often looks safer than it is when only a handful of sectors are carrying estimates, flows and sentiment at the same time.
A fourth risk is policy translation. Headline support only matters if it reaches profits, spending, trade volumes, or balance sheets. The market usually punishes the gap between official intent and realized earnings more than the headline itself.
| Investor type | Main risk | Suggested posture | What to monitor next |
|---|---|---|---|
| Already profitable | Giving back gains during a de-rating | Cut size into failed breakouts | Revisions breadth, yields, and valuation |
| Currently losing | Averaging into a thesis that has changed | Add only after trigger conditions improve | Forward estimates and policy follow-through |
| No position | Buying a weak setup too early | Wait for data confirmation or cheaper levels | Macro releases, breadth and support levels |
The countercase is strongest when it is dated and measurable. That is why valuation, inflation, revisions and policy transmission matter more here than broad claims about sentiment.
04. Institutional Lens
What institutional data would need to confirm for the rally to stay credible
The institutional read should start with primary data rather than branding. For Shenzhen Index, the accessible high-quality sources are the official index provider or exchange, the relevant national statistical agencies, and the IMF's April 2026 baseline. The IMF's April 2026 regional work still framed Asia as the global growth leader, but emphasized that higher energy costs and geopolitical shocks are narrowing policy room.
The second layer is market structure. Shenzhen's most active names in the official spring bulletins were optical-link and solar-related companies, which captures the market's ongoing bias toward AI infrastructure and power-electronics themes. That matters because institutional investors typically change their weight only after revisions, liquidity and policy transmission move together.
When a named institution is useful here, it is because it provides a dated and measurable input. In this case, the relevant dated inputs include 29.92x average P/E in the April 3, 2026 SZSE bulletin, down from 33.59x in the March 6, 2026 bulletin, china's gdp rose 5.0% in q1 2026 and cpi rose 1.2% in april 2026, but the domestic-demand split remains uneven and real-estate investment is still contracting. and the IMF's April 2026 projections. That is a stronger foundation than attaching a bank name to a generic narrative.
| Source | Latest dated input | What it says | Why it matters |
|---|---|---|---|
| Index provider / exchange | around 13,700 in early April 2026 | 29.92x average P/E in the April 3, 2026 SZSE bulletin, down from 33.59x in the March 6, 2026 bulletin | Defines the current pricing starting point |
| Official macro data | March-April 2026 releases | China's GDP rose 5.0% in Q1 2026 and CPI rose 1.2% in April 2026, but the domestic-demand split remains uneven and real-estate investment is still contracting. | Shows whether demand and inflation are helping or hurting the equity case |
| IMF | April 2026 | The IMF's April 2026 regional work still framed Asia as the global growth leader, but emphasized that higher energy costs and geopolitical shocks are narrowing policy room. | Sets the broad macro corridor for base-case probabilities |
That is the practical value of institutional work: not false precision, but a disciplined list of the variables that actually deserve monitoring.
05. Scenarios
Actionable upside scenarios
The actionable bull setup is not simply a rising chart. It is a rally that survives the next macro release and the next earnings reset without losing breadth.
If the market extends on better revisions and stable yields, holding core exposure makes sense. If the move extends only because a narrow group keeps squeezing higher, trimming into strength is more rational than pretending all breakouts are equal.
The next review point should be the next earnings season plus the next inflation cycle, because that is where the market learns whether it is paying for reality or for hope.
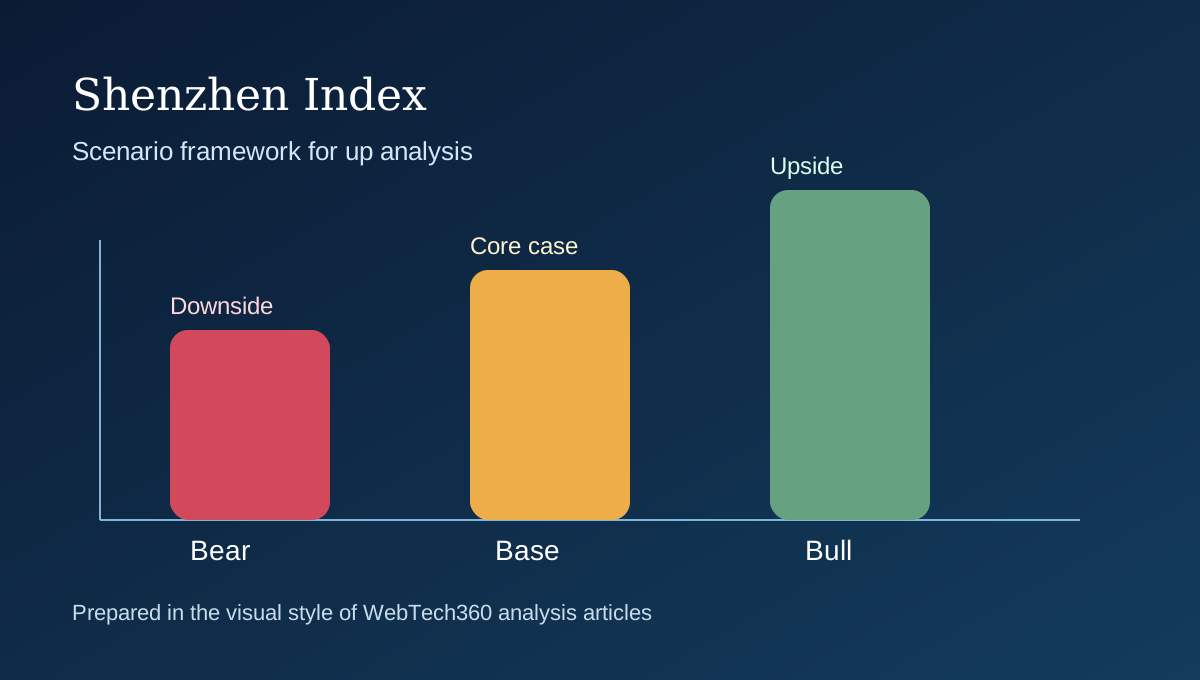
| Scenario | Probability | Trigger conditions | Review point |
|---|---|---|---|
| Breakout extends | 40% | Positive estimate revisions, broader sector participation, and stable real rates | Review after the next earnings season |
| Range grind | 35% | Price holds up but breadth stays mixed and valuations stop rerating | Review on the next major macro print |
| Failed rally | 25% | Leadership narrows, guidance softens, or yields rise sharply | Review immediately if support breaks on weak breadth |
These scenarios are not trading instructions. They are a framework for deciding when the evidence is getting stronger, when it is getting weaker, and when patience is the better position.
References