01. Historical Context
The bearish path starts with a decent stock becoming too fully valued
UL has not rolled over because the business is weak. Q1 2026 still showed 3.8% underlying sales growth and 2.9% volume growth. The risk is that those numbers are merely decent while the stock is already priced for continued progress at about 15.12x forward earnings.
| Horizon | What matters most | What would strengthen the bearish view | What would weaken the bearish view |
|---|---|---|---|
| 1-3 months | Whether the next update confirms weaker momentum | Growth stays below 4% and volume cools | Q2 shows acceleration versus Q1 |
| 6-12 months | Valuation and rates | Sticky inflation keeps multiples under pressure | Disinflation allows a better risk appetite backdrop |
| To 2027 | Estimate direction | 2027 EPS estimates move down | Analysts keep or raise the current EPS path |
That is why the bearish case should be treated as a scenario about expectation management. The share price can fall without the operating business falling apart.
02. Key Forces
Five bearish forces that could push the stock lower
First, inflation is still sticky. U.S. CPI was 3.8% in April 2026, first-quarter PCE inflation was 4.5%, core PCE was 4.3%, and euro-area inflation was 3.0%. That is enough to keep the discount-rate debate alive.
Second, Q1 growth did not clear the company's own full-year guide. Underlying sales growth of 3.8% was below the low end of the 4% to 6% full-year range, which means the next few quarters have to do more of the work.
Third, the current multiple is fair rather than distressed. At about 15x forward earnings, UL still has room to rerate lower if the market becomes less willing to pay for defensive stability.
Fourth, portfolio actions come with cost. The Foods combination with McCormick includes stranded-overhead and restructuring charges that could weigh on sentiment if growth softens.
Fifth, the stock's own history argues against complacency. Yahoo's 10-year adjusted range shows UL can trade much lower than today's level when investors decide the growth and valuation mix has become less attractive.
| Factor | Current Assessment | Bias | Why it matters now |
|---|---|---|---|
| Inflation backdrop | CPI and PCE remain elevated | Bearish | Higher-for-longer rates can pressure a 15x forward multiple |
| Growth pace | Q1 sales growth at 3.8% trails the guide floor | Bearish | Leaves little room for soft follow-through |
| Valuation cushion | Forward PE around 15x | Neutral to Bearish | The stock is not cheap enough to ignore disappointment |
| Portfolio execution | Foods transaction brings execution costs | Neutral | Strategic upside exists, but near-term friction can still hurt sentiment |
| Analyst expectations | Consensus still expects EPS growth into 2027 | Bearish if cut | Downward revisions would likely hit the stock quickly |
For the bearish view to gain credibility, those factors need to line up at once. On their own, each is manageable. Together, they can create a real de-rating.
03. Countercase
What could stop the decline from extending
The strongest counterargument is that the underlying business still looks stable. Volume is positive, free cash flow was EUR5.9 billion in 2025, and productivity savings are already largely delivered. Those are not the ingredients of a broken consumer staples name.
The second counterargument is capital return. Active buybacks can absorb some valuation pressure if operations remain healthy. The disclosed potential for up to EUR6 billion of repurchases through 2029 is meaningful if management stays on track.
The third counterargument is that global growth is still positive. IMF forecasts of 3.1% and 3.2% global growth for 2026 and 2027 do not support a recessionary base case for staples.
| Signal | Latest data point | Current Assessment | Bias |
|---|---|---|---|
| Volume resilience | Q1 2026 volume up 2.9% | Still supportive | Bullish counterpoint |
| Cash generation | 2025 free cash flow at EUR5.9 billion | Solid balance-sheet support | Bullish counterpoint |
| Buybacks | EUR1.5 billion already underway | Can cushion per-share downside | Bullish counterpoint |
The bearish case therefore works best as a risk-control framework, not as a claim that the business is structurally impaired.
04. Institutional Lens
What outside research says about the downside
J.P. Morgan Asset Management's 2026 outlook is important here because it argues that markets can still correct even in a fundamentally decent environment. That fits Unilever well: the business can stay okay while the stock still moves lower if inflation and rates stay uncomfortable.
MarketBeat's current target range of $60.10 to $71.00 also implies that a move below the low end of that range would likely require estimate cuts or a broader valuation reset rather than normal trading noise. That helps define what "real downside" should look like.
| Source | Updated | What it says | Why it matters here |
|---|---|---|---|
| J.P. Morgan AM | 2026 outlook | Markets can still correct despite solid fundamentals | Supports the de-rating risk argument |
| BLS and BEA | April and Q1 2026 | Inflation remains elevated | Explains why rates can still pressure valuation |
| MarketBeat | May 2026 | ADR low target at $60.10 | A break materially below that level would imply a harsher market view |
| MarketScreener | May 2026 | Consensus still expects EPS growth into 2027 | Bearish conviction rises if those estimates start to fall |
The institutional lens does not support panic. It supports monitoring whether the market is beginning to cut estimates and compress multiples at the same time.
05. Scenarios
Who should wait, who should reduce, and who can stay constructive
| Scenario | Probability | Trigger | Target range | Review point |
|---|---|---|---|---|
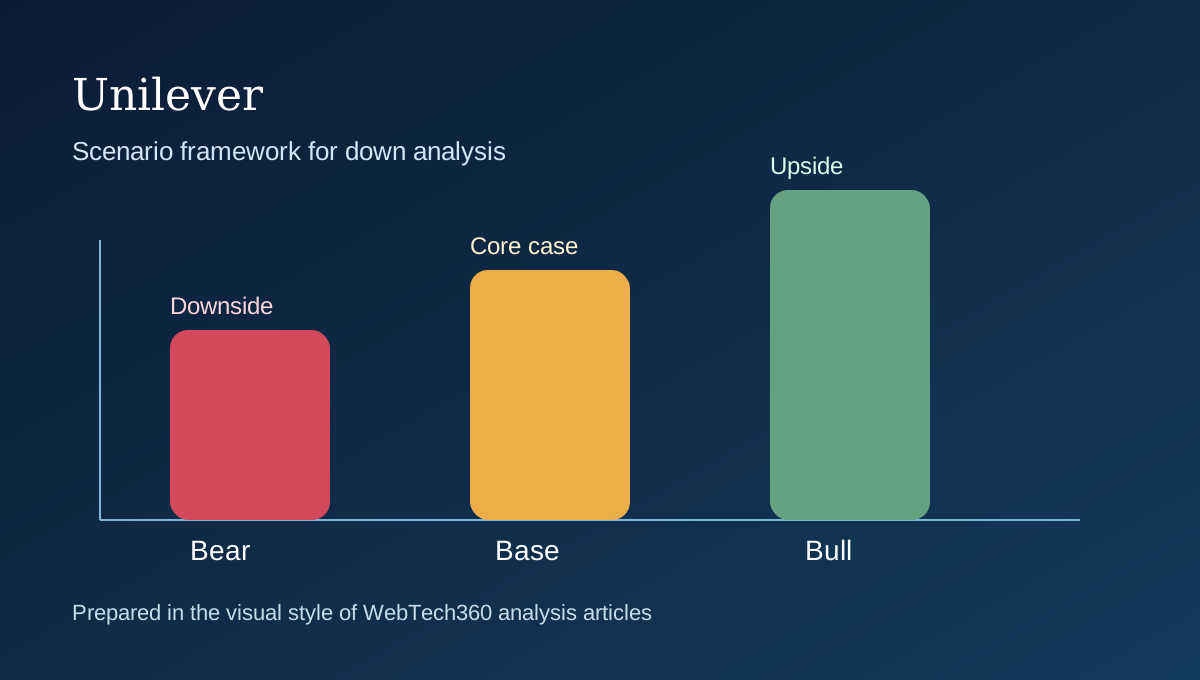
| Bear | 35% | Growth stays below 4%, inflation stays sticky, and analysts cut EPS expectations | $48 to $55 | Review after the next two trading updates and FY2026 results |
| Base | 35% | The business remains stable but the stock stays range-bound around current valuation | $55 to $60 | Reassess if the stock cannot recover despite guidance stability |
| Bullish reversal | 30% | Volume and guidance re-accelerate enough to restore confidence | $61 to $67 | Review if Q2 and H2 data confirm improving momentum |
The risk-control message is simple: downside becomes more serious only when softer growth and a lower multiple start reinforcing each other.
References
Sources
- Yahoo Finance 10-year chart data for UL
- StockAnalysis valuation statistics for UL
- Unilever Q1 2026 trading statement
- Unilever FY2025 full-year announcement
- U.S. Bureau of Labor Statistics CPI release for April 2026
- U.S. Bureau of Economic Analysis advance GDP estimate for Q1 2026
- Eurostat flash estimate for euro-area inflation in April 2026
- J.P. Morgan Asset Management 2026 investment outlook
- MarketBeat analyst target range for UL
- MarketScreener earnings estimates for Unilever's European line