01. Historical Context
The stock can still rise because the operating base is improving
Unilever's Q1 2026 numbers matter more than any slogan. Turnover was EUR12.6 billion, underlying sales growth was 3.8%, and volume rose 2.9%. That is the sort of mix that can support a higher share price because it shows the company is still getting real demand, not just price carry.
| Horizon | What matters most | What would strengthen the thesis | What would weaken the thesis |
|---|---|---|---|
| 1-3 months | Whether Q2 confirms Q1 volume | Another quarter of positive volume and stable mix | Growth slipping below the guidance floor |
| 6-12 months | EPS and free-cash-flow conversion | Consensus estimates hold or rise | Margin pressure or weaker cash conversion |
| To 2027 | Shareholder returns | Buybacks and productivity keep lifting per-share earnings | Capital returns slow or portfolio costs absorb gains |
The reason the upside is not purely speculative is that Unilever also ended 2025 with a 20.0% underlying operating margin and EUR5.9 billion of free cash flow. That gives the company enough financial room to keep rewarding shareholders while it executes.
02. Key Forces
Five bullish forces that could extend the move
First, current valuation still leaves room for gains. UL traded at 11.15x trailing earnings and 15.12x forward earnings on May 15, 2026. For a defensive business with improving volume, that is not a stretched setup.
Second, the earnings bridge is still constructive. MarketScreener's estimate path of EUR3.03 EPS for 2026 and EUR3.261 for 2027 implies that analysts still see meaningful per-share growth ahead.
Third, productivity is arriving. Unilever said it had already delivered EUR750 million of the EUR800 million savings target due by the end of 2026. That strengthens the case for margin support even if the macro backdrop stays mixed.
Fourth, buybacks are real. The EUR1.5 billion repurchase already launched, plus the disclosed potential for up to EUR6 billion of buybacks through 2029, make the upside case more tangible because they improve per-share math even without an aggressive sales acceleration.
Fifth, the macro backdrop is soft but not recessionary. IMF global growth forecasts of 3.1% for 2026 and 3.2% for 2027 are good enough for a staples compounder if inflation does not worsen materially.
| Factor | Current Assessment | Bias | Why it matters now |
|---|---|---|---|
| Volume trend | Q1 2026 volume up 2.9% | Bullish | Positive volume is the strongest confirmation of a healthy advance |
| EPS path | Consensus still points higher into 2027 | Bullish | The stock can rerate modestly if estimates remain intact |
| Productivity | EUR750 million of savings already delivered | Bullish | Supports margins and confidence in execution |
| Capital return | Buybacks are active and potentially large through 2029 | Bullish | Strengthens the per-share compounding case |
| Macro backdrop | Growth remains positive, inflation remains sticky | Neutral | Good enough for upside, but not good enough to ignore rates |
Taken together, those factors support a constructive stance. The stock does not need a new narrative. It needs more quarters that look like Q1 2026.
03. Countercase
What could interrupt the rally
The main risk is still rates. U.S. CPI was 3.8% in April 2026, first-quarter PCE inflation was 4.5%, core PCE was 4.3%, and euro-area inflation was 3.0%. If that inflation profile lingers, the multiple can stall even if operations are decent.
The second risk is a growth disappointment against management's own 4% to 6% sales-growth guide. A stock with a credible bullish case can still fall if the next two updates fail to confirm the current pace.
The third risk is execution around portfolio simplification and stranded costs. That does not invalidate the long-term case, but it can slow the near-term rerating.
| Risk | Latest data point | Current Assessment | Bias |
|---|---|---|---|
| Sticky inflation | CPI and PCE are still elevated | Still the biggest multiple headwind | Bearish |
| Guide miss | Q1 growth was 3.8% versus a 4% to 6% full-year guide | Needs stronger follow-through | Neutral |
| Execution drag | Portfolio changes bring stranded-cost and restructuring risks | Manageable, but worth watching | Neutral |
The bullish case remains valid only while the operating evidence keeps improving faster than these risks worsen.
04. Institutional Lens
Sell-side inputs are constructive, but not euphoric
MarketBeat's current ADR target average of $65.55, with a $60.10 low and $71.00 high, frames a realistic bullish corridor for the next 12 months. MarketScreener's 2026 and 2027 EPS estimates on the European line also support an orderly advance rather than an explosive rerating.
Macro research is consistent with that view. IMF forecasts still show positive global growth, while J.P. Morgan Asset Management warns that corrections can still happen even in a decent macro backdrop. That combination is exactly the kind of environment in which Unilever can outperform without looking dramatic.
| Source | Updated | What it says | Why it matters here |
|---|---|---|---|
| MarketBeat | May 2026 | Average ADR target $65.55; high $71.00 | Shows the market still sees incremental upside |
| MarketScreener | May 2026 | 2026 EPS EUR3.03; 2027 EPS EUR3.261 | Supports the earnings-led bull case |
| IMF WEO | April 14, 2026 | Global growth remains positive through 2027 | Helps the demand side stay orderly |
| J.P. Morgan AM | 2026 outlook | Growth may moderate, but volatility remains possible | Upside should be expected to come with resets |
The institutional lens therefore supports further upside, but it supports it as a disciplined grind rather than as a one-way move.
05. Scenarios
How to think about buying, holding, or trimming from here
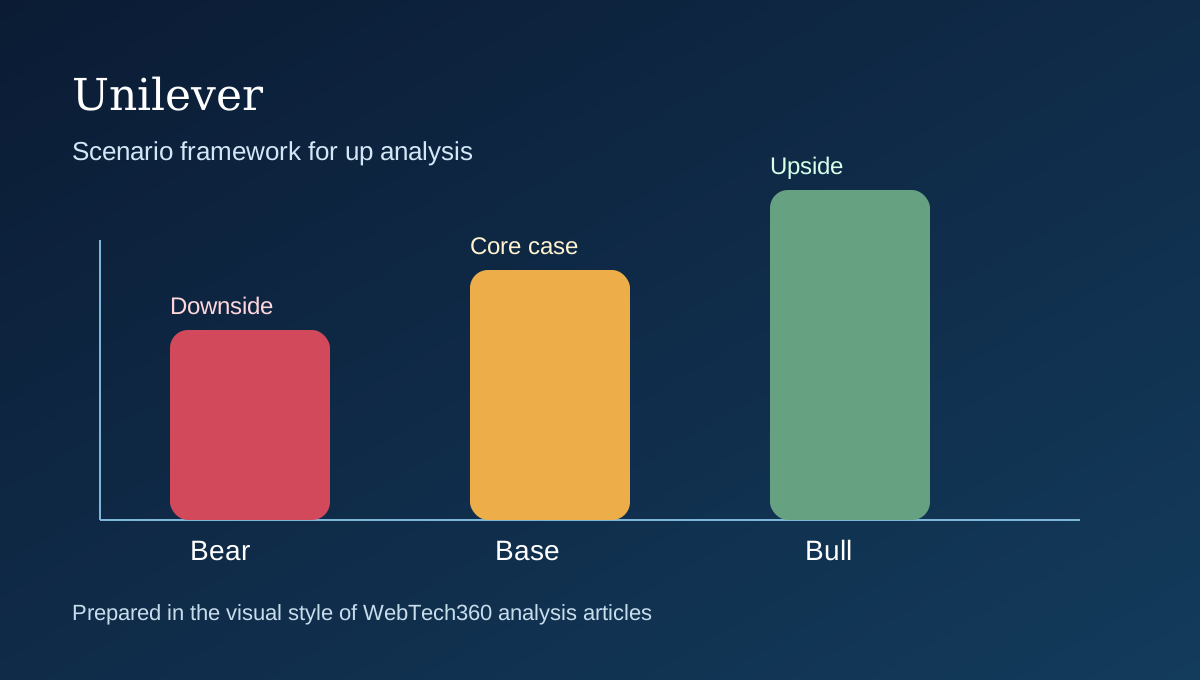
| Scenario | Probability | Trigger | Target range | Review point |
|---|---|---|---|---|
| Bull | 40% | Volume stays above 2%, guidance holds, and analysts keep the 2027 EPS path intact | $63 to $71 | Review after the July 2026 half-year update and November 4, 2026 Capital Markets Day |
| Base | 35% | Execution stays decent, but inflation caps valuation expansion | $57 to $62 | Reassess after FY2026 results |
| Bear | 25% | Growth slows below guidance or the market derates staples multiples | $48 to $55 | Review if volume drops below the 2% guide floor |
The highest-quality bullish setup is one in which results keep doing the work. If price rises while volume, EPS, and buybacks all stay supportive, the rally remains investable.
References
Sources
- Yahoo Finance 10-year chart data for UL
- StockAnalysis valuation statistics for UL
- Unilever FY2025 full-year announcement
- Unilever Q1 2026 trading statement
- IMF World Economic Outlook, April 2026
- J.P. Morgan Asset Management 2026 investment outlook
- MarketBeat analyst target range for UL
- MarketScreener earnings estimates for Unilever's European line