01. Historical Context
WTI Oil in context: today's price is near the top of the 10-year closing range
WTI should be framed as a physical benchmark, not as an equity. P/E, EPS, and earnings-revision breadth do not apply here. The relevant valuation variables are the spot price, the futures curve, inventories, spare capacity, and the marginal cost of incremental supply.
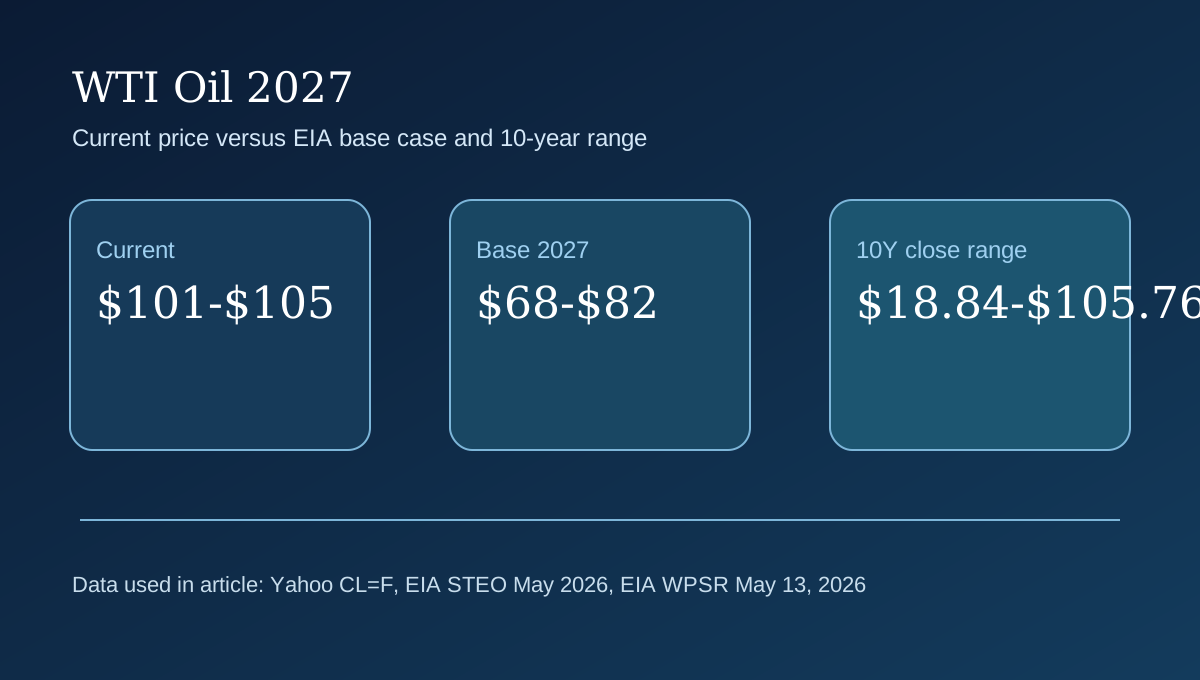
Using Yahoo Finance monthly data for CL=F, the front-month contract closed as low as $18.84 in April 2020 and as high as $105.76 in June 2022 over the last 10 years. Yahoo also shows a 52-week range of $54.98 to $119.48, while the latest front-month regular market price was $101.02 on May 14, 2026. That puts the current market in the upper decile of the post-2016 range rather than at a neutral mid-cycle level.
| Horizon | What matters most | Measured trigger | Current read |
|---|---|---|---|
| 1-3 months | Hormuz flows, prompt backwardation, U.S. inventory draws | WTI spot stays above $95 and OECD-visible inventories keep falling | Still bullish but headline-sensitive |
| 6-12 months | Rate of OPEC+ supply recovery and demand elasticity | IEA deficit persists beyond 4Q26 and EIA 2H26 WTI stays near $90 | Mixed |
| To 2027 | Normalization versus structural undersupply | WTI average settles closer to EIA's $74.39 2027 mean or re-rates above $90 | Base case favors normalization |
EIA's May 2026 STEO puts the annual average WTI price at $85.68 in 2026 and $74.39 in 2027. Quarter by quarter, the same table shows WTI averaging $96.42 in 2Q26, $90.06 in 3Q26, and $83.00 in 4Q26 before easing through 2027. That trajectory is the cleanest official benchmark currently available.
The market is therefore pricing disruption today and partial repair tomorrow. A 2027 forecast that simply extrapolates the May 2026 spot price would ignore both EIA's path and the historical pattern of oil spikes mean-reverting once logistics and supply conditions improve.
02. Key Forces
Five forces that matter most for the path to 2027
First, supply disruption is the dominant driver. EIA said on May 12, 2026 that 10.5 million barrels per day of crude output from Iraq, Saudi Arabia, Kuwait, the UAE, Qatar, and Bahrain had been shut in during the prior month. IEA's May 13 report went further, saying global oil supply fell by 1.8 million barrels per day in April to 95.1 million barrels per day and that total losses since February had reached 12.8 million barrels per day.
Second, inventories are drawing at a pace that usually supports backwardation and high prompt prices. IEA reported a 129 million barrel draw in March and another 117 million barrel draw in April. EIA's weekly report for the week ending May 8, 2026 showed U.S. commercial crude inventories at 452.876 million barrels, down 4.305 million barrels week over week and up 11.046 million barrels from a year earlier.
Third, demand is no longer a one-way bull story. IEA now forecasts global oil demand to contract by 420,000 barrels per day year over year in 2026 to 104 million barrels per day, which is 1.3 million barrels per day below its pre-war forecast. That tells investors the current price is being sustained by supply destruction, not by booming end demand.
Fourth, the macro backdrop is supportive of volatility, not certainty. IMF cut the global growth corridor to 3.1% for 2026 and 3.2% for 2027 in its April 2026 WEO. In the United States, BLS reported April 2026 CPI up 0.6% month over month and 3.8% year over year, while BEA put March 2026 headline PCE at 3.5% and core PCE at 3.2%. Higher oil is already feeding the inflation side of the equation.
Fifth, U.S. supply is cushioning but not fully offsetting the shock. EIA expects U.S. crude production to average 13.65 million barrels per day in 2026 and 14.10 million barrels per day in 2027, while the latest weekly estimate reached 13.71 million barrels per day. That helps cap the long tail of a spike, but it does not remove the near-term shortage.
| Factor | Latest datapoint | Current assessment | Bias |
|---|---|---|---|
| Spot and curve | WTI spot $104.52 on May 13; prompt spreads near $5/bbl in April | Backwardation still says prompt supply is tight | Bullish near term |
| Inventories | U.S. commercial crude 452.876 mb; IEA global stocks -246 mb over Mar-Apr | Draws remain supportive | Bullish |
| Demand | IEA 2026 demand -420 kb/d y-o-y | Demand no longer validates $100 as a stable equilibrium | Bearish medium term |
| Macro | IMF global growth 3.1% in 2026; U.S. CPI 3.8% y/y in April | Inflation risk rises as growth softens | Mixed to bearish |
| Supply response | EIA U.S. crude output 14.10 mb/d forecast for 2027 | Non-Middle East supply should rebuild part of the gap | Bearish for 2027 |
On balance, the near-term tape and the 2027 tape are pointing in different directions. The current market is trading a shortage. The 2027 market is more likely to trade how much of that shortage remains after damaged flows, emergency stock releases, and Atlantic Basin supply growth work through the system.
03. Countercase
What would break the 2027 base case
The first risk to the base case is that the supply disruption lasts much longer than EIA and IEA currently assume. World Bank said on April 28, 2026 that Brent could average as high as $115 in 2026 if critical facilities suffer more damage and export volumes are slow to recover. A comparable WTI outcome would imply that even a $90-$110 2027 bull case may prove too conservative.
The second risk is the opposite: demand destruction arrives faster than supply normalization. IEA has already moved to a 420,000 barrel per day contraction in 2026 global oil demand. If April's CPI acceleration and the 17.9% year-over-year increase in the energy CPI force tighter financial conditions, oil may lose support faster than the physical market tightens.
Third, weekly U.S. stocks are still above year-ago levels despite the latest draw. Commercial crude inventories were 2.5% above the same week a year earlier as of May 8, 2026. If that year-over-year cushion starts rising again while Atlantic Basin production keeps increasing, the market will have a harder time defending triple-digit prices.
Fourth, oil spikes are self-limiting when they become an inflation tax. EIA still expects U.S. GDP growth of 2.0% in both 2026 and 2027, but BEA's advance estimate showed only 2.0% annualized growth in Q1 2026. If real growth slips further while fuel prices stay elevated, the demand side of the thesis weakens quickly.
| Risk | Latest data | What would confirm it | Bias impact |
|---|---|---|---|
| Demand destruction | IEA 2026 demand -420 kb/d | Further downward revisions in IEA or EIA demand tables | Bearish |
| Inventory rebuild | U.S. crude stocks still 11.046 mb above year-ago level | Several consecutive weekly builds | Bearish |
| Macro squeeze | CPI 3.8% y/y; headline PCE 3.5% y/y | Higher real yields and weaker growth data | Bearish |
| Supply shock persistence | 10.5 mb/d shut in per EIA | Flows do not normalize by 3Q26 | Bullish, breaks base case |
The clean read is that the bearish path is not hypothetical anymore; it is already embedded in the official demand revisions. What still holds prices up is the severity of the supply outage. If supply normalizes even moderately, the bearish inputs become more visible in the flat price.
04. Institutional Lens
What the latest institutional data is actually saying
EIA updated its view on May 12, 2026 and now forecasts annual average WTI at $85.68 in 2026 and $74.39 in 2027. That is the most direct official benchmark for a 2027 WTI article. It reflects a high 2Q26 average of $96.42 and a step-down path through 2027 rather than a sustained super-spike.
IEA updated on May 13, 2026 and kept the market in deficit through the final quarter of 2026. It also said global demand is contracting year over year and that observed inventories drew by 246 million barrels across March and April combined. In other words, IEA is not delivering a simple bullish narrative; it is describing a shortage that is being partially offset by demand damage.
IMF updated on April 14, 2026 and cut the global growth backdrop to 3.1% in 2026 and 3.2% in 2027, while World Bank updated on April 28, 2026 and said Brent could average $86 in 2026 under its baseline and as high as $115 under a worse disruption scenario. Those macro sources matter because they shape the demand corridor around the physical oil story.
| Source | Updated | What it said | Why it matters for WTI |
|---|---|---|---|
| EIA STEO | May 12, 2026 | WTI averages $85.68 in 2026 and $74.39 in 2027 | Base case anchor |
| IEA OMR | May 13, 2026 | 2026 oil demand contracts 420 kb/d; market stays in deficit until 4Q26 | Explains why spot can stay firm while 2027 still softens |
| IMF WEO | April 14, 2026 | Global growth 3.1% in 2026 and 3.2% in 2027 | Sets the macro demand corridor |
| World Bank CMO | April 28, 2026 | Brent baseline $86 in 2026; stress case $115 | Confirms broad upside asymmetry under prolonged disruption |
The highest-conviction conclusion from those sources is not that $100 oil is impossible in 2027. It is that the official base case still leans toward normalization, while the upside tail remains attached to geopolitics rather than to a structurally tighter demand cycle.
05. Scenarios
Scenario analysis and action thresholds into 2027
The base case carries a 50% probability: WTI trades mostly in a $68-$82 range in 2027, close to EIA's $74.39 annual average. The trigger is partial restoration of Gulf exports by 2H26, U.S. production near EIA's 14.10 million barrel per day 2027 forecast, and no renewed global inventory collapse. The review point is the September 2026 and December 2026 EIA/IEA updates.
The bull case carries a 30% probability: WTI averages $90-$110 in 2027. That needs repeated evidence that flows through Hormuz remain constrained, that prompt spreads stay wide through late 2026, and that weekly U.S. crude inventories trend materially below their year-ago level. The review point is any sustained failure of Brent and WTI to retreat during 4Q26.
The bear case carries a 20% probability: WTI averages $50-$65 in 2027. That requires synchronized demand damage, several months of inventory rebuilding, and a visible supply rebound outside the Gulf. The review point is whether IEA's current 2026 demand contraction becomes a larger decline and whether EIA starts revising 2027 oil prices lower.
| Scenario | Probability | Target range | Trigger and review point |
|---|---|---|---|
| Base | 50% | $68-$82 | Flows normalize in stages; review after September and December 2026 STEO/OMR |
| Bull | 30% | $90-$110 | Deficit persists into 2027; review if WTI still holds above $90 by 4Q26 |
| Bear | 20% | $50-$65 | Demand weakens and stocks rebuild; review if weekly builds dominate by late summer 2026 |
For investors already long, the practical discipline is to treat prices above the EIA base path as geopolitical premium rather than as a new equilibrium until inventories and flows prove otherwise. For readers without exposure, the better question is whether the market is paying you for event risk or asking you to chase it.
References
Sources
- Yahoo Finance chart API for CL=F 10-year monthly history
- EIA Daily Prices page, including WTI spot and Brent spot updates
- EIA Weekly Petroleum Status Report, latest week ending May 8, 2026
- EIA Short-Term Energy Outlook tables, May 2026
- EIA press release on the May 12, 2026 STEO update
- IEA Oil Market Report, May 2026
- IMF World Economic Outlook, April 2026
- World Bank Commodity Markets Outlook press release, April 28, 2026
- BLS CPI release for April 2026
- BEA headline PCE price index page
- BEA core PCE price index page
- BEA GDP advance estimate for Q1 2026