Home
» Today
»
Tesla Shares and EV Growth: What New 2026 Data Mean for TSLA | November 11, 2026
Tesla Shares and EV Growth: What New 2026 Data Mean for TSLA | November 11, 2026
Last checked: November 11, 2026, 9:04 p.m. Sydney AEDT (UTC+11:00; 10:04 UTC). The stock-market figure below refers to the most recently completed U.S. regular trading session, not a live quote.
Electric vehicle demand is expanding, but that does not guarantee higher Tesla shares. Tesla reported 486,532 global vehicle deliveries for the third quarter of 2026, about 2% fewer than a year earlier, even as Australian battery-electric vehicle sales hit another quarterly high. For investors, the essential question is not simply whether more drivers are choosing EVs. It is whether Tesla can convert that shift into profitable growth while defending its share against an expanding field of competitors.
The distinction matters right now. Tesla’s latest quarterly update shows automotive revenue slightly below its year-earlier level and operating profit down more sharply, while its energy-storage business continued to deploy substantial capacity. Meanwhile, the International Energy Agency expects the worldwide electric-car market to grow in 2026, but that is a market forecast—not a Tesla earnings forecast. The latest verified U.S. regular-session close for Tesla stock (NASDAQ: TSLA) was $379.78 on November 10, 2026, according to TSLA historical trading data. That close occurred at 4:00 p.m. New York EST (UTC−05:00), or 8:00 a.m. Sydney AEDT (UTC+11:00) on November 11.
Destaques
Tesla’s Q3 2026 deliveries: 486,532 vehicles, down about 2% year over year, according to the company.
Australia’s EV market: 76,947 battery-electric vehicles were sold during the September quarter, representing 24.34% of new light-vehicle sales, the AAA reported.
Global direction: The IEA forecasts about 23 million electric-car sales worldwide in 2026; this is a projection, not a completed-year result.
What affects TSLA: Market share, vehicle pricing, margins, energy storage, autonomy expectations and investors’ valuation assumptions can outweigh raw EV sales growth.
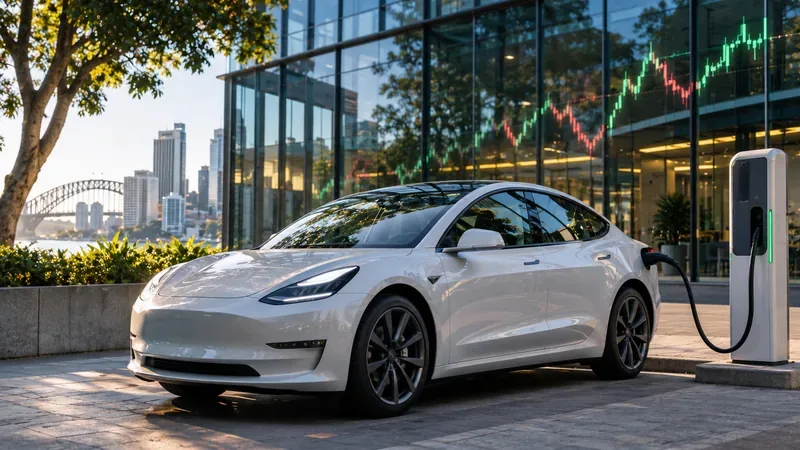
Illustration: An electric sedan at a charging station beside conceptual market graphics. The chart is not an actual record of Tesla share prices, and the vehicle is not presented as a photographed Tesla model.
What does Tesla’s latest sales report reveal about the EV market?
Tesla’s Tesla’s October 2 delivery announcement puts production at 464,391 and deliveries at 486,532 vehicles in July–September 2026. Most of those deliveries—478,237—came from the Model 3 and Model Y families. Its Tesla’s Q3 2026 shareholder update gives the year-earlier comparison of 497,099 deliveries. The current quarter was therefore stronger than the previous quarter’s 480,126 deliveries, yet lower than the same period in 2025. Both comparisons are necessary: sequential improvement can coexist with annual decline.
The company’s financial update also illustrates why counting cars does not tell the whole investment story:
Metric
Q3 2026
Year-over-year comparison
Global vehicle deliveries
486,532
Down about 2%
Automotive revenue
$20.56 billion
Down 3%
Operating income, company-wide
$718 million
Down 56%
Energy-storage deployments
13.7 GWh
Up 10%
These figures come from Tesla’s Q3 shareholder update. The operating-income figure covers the whole company and should not be interpreted as a stand-alone automotive margin. Higher operating expenses, product mix, pricing and other business developments can affect earnings independently of deliveries. Tesla itself cautions that vehicle deliveries are only one measure of performance.
Is Australia’s growing EV market good news for Tesla stock?
It offers a potential opportunity, not an automatic financial result. The Australian Automobile Association EV Index, September quarter 2026 published on November 5 reports a record 76,947 battery-electric vehicles sold during the three months ended September 30, 2026. That represented 24.34% of Australia’s new light-vehicle market, up from 21.03% in the June quarter. These figures measure the entire BEV market, including Tesla’s competitors; they should not be treated as Tesla registrations.
The latest brand-specific release adds useful detail. According to the Electric Vehicle Council’s November 3 October-sales release, issued November 3, Tesla recorded 4,050 Australian deliveries in October 2026, 342% above October 2025. Of that total, the Model Y accounted for 3,105 deliveries and the Model 3 for 945. The council counts vehicles at delivery rather than when orders are placed. Tesla also described Australia as one of its record quarterly-delivery markets in its Q3 shareholder update.
Those are favorable demand signals for Tesla in Australia, but monthly results can be influenced by shipment arrivals, model changes, promotions and a weak year-earlier comparison. A 342% annual increase in one country and one month cannot establish a similar increase in Tesla’s worldwide revenue, profits or share valuation. Australian buyers also face a widening choice of electric models, so Tesla’s market share matters alongside the growth of the category.
Why can the EV market grow while Tesla shares fall?
1. Competition can grow faster than Tesla
EV adoption expands the addressable market, but the gains do not belong to one automaker. The IEA Global EV Outlook 2026 says global electric-car sales exceeded 20 million in 2025, up about 20%, and projects roughly 23 million in 2026. Its definition includes battery-electric and plug-in hybrid cars, whereas Tesla principally sells battery-electric cars. Chinese manufacturers, established auto companies and newer entrants all compete for those buyers. If industry sales expand faster than Tesla deliveries, Tesla can lose share even when the total market reaches new records.
2. Price reductions may lift volume without lifting profits
Automotive earnings depend on average selling prices and the cost of producing, transporting and supporting each vehicle. Discounts can make a car more competitive and help factories operate closer to capacity, but they may also lower the profit per unit. The opposite can happen if manufacturing efficiencies or a richer product mix offset lower prices. Investors therefore watch margins and cash generation alongside headline delivery counts.
3. TSLA reflects more businesses and more expectations than EV sales
Tesla also sells energy-storage products and services, operates a charging network and invests in autonomous-driving technology and robotics. Those initiatives may affect how investors value future growth, but their ultimate profitability and deployment scale are uncertain. Changes to interest rates, capital spending, regulation, tariffs, battery costs and investor risk appetite can also move TSLA independently of any particular month’s EV registrations. A rising stock price is not proof that vehicle demand improved; a falling price is not proof that demand collapsed.
How should Australian investors read Tesla’s U.S. share price?
TSLA is a U.S.-listed stock quoted in U.S. dollars, not an Australian dollar share price. For an Australian investor, the local-currency value of a position also changes with the AUD/USD exchange rate, and broker fees or foreign-exchange spreads can affect transaction costs. Keep the trading-session date attached to a quote: a U.S. market close can be displayed on the following calendar day in Sydney during Australian daylight saving time. Australia has multiple time zones, so Sydney AEDT is not the correct label for all Australian states.
It is more informative to compare the same periods than to match a daily share move to an unrelated monthly sales release. A quarterly earnings report may have been anticipated before publication, while an unexpected margin change could move the stock even when vehicle numbers meet expectations. Daily moves should not be assigned to a single cause without evidence.
What data should investors monitor next?
Four groups of indicators provide a practical framework. Start with global Tesla deliveries and regional registrations to measure demand and market share. Then examine automotive revenue, average selling price when disclosed, margins and free cash flow to see whether higher volume is economically useful. Next, compare Tesla’s growth with industry data from the IEA and national auto organizations, keeping BEV and PHEV definitions consistent. Finally, monitor management’s reported progress, costs and regulatory milestones for energy storage and autonomy-related projects rather than assuming announced potential is already earned revenue.
Conditional outlook: If EV adoption continues to increase and Tesla protects its market share and margins, that could support earnings expectations. If rivals capture more growth or price competition cuts profit per vehicle, a larger EV market may not translate into a stronger Tesla stock price. If investors significantly revise assumptions about energy or autonomy-related earnings, TSLA could move for reasons only partly connected with passenger-car sales. None of these scenarios is a prediction of the next trading session.
FAQ: Tesla stock and electric vehicles
Does higher electric vehicle demand always push Tesla stock up?
No. Stronger industry demand creates opportunities, but the share price also reflects Tesla’s market share, profitability, future growth expectations and broader financial conditions.
Are Australian EV sales the same as Tesla global deliveries?
No. Australian EV market statistics include many manufacturers and often distinguish battery-electric vehicles from plug-in hybrids. Tesla’s worldwide delivery figures cover its own vehicles across markets.
Which Tesla figures matter most after a delivery report?
Compare year-over-year deliveries with automotive revenue, margin trends, operating income and cash flow. These help explain whether sales are turning into sustainable financial performance.
This article is for general information and does not constitute personalized investment advice. Figures and projections are identified by their respective reporting periods and sources.