Home
» Today
»
UK House Prices: How Mortgage Rates, Supply and Local Demand Shape the Market | Updated Nov. 6, 2026
UK House Prices: How Mortgage Rates, Supply and Local Demand Shape the Market | Updated Nov. 6, 2026
Updated: November 6, 2026, at 1:11 p.m. GMT (UTC+00:00).
The latest official UK house-price figures, published by the Office for National Statistics (ONS) on October 21, show a market that is still rising overall but losing momentum and moving at different speeds across the country. The UK average was £273,000 in August 2026, up 0.9% from a year earlier, down from 1.2% annual growth in July. England recorded just 0.4% annual growth, compared with 3.1% in Wales and 2.9% in Scotland. Northern Ireland’s latest figure covers April through June, so it is not directly comparable with the August data.
That uneven picture helps explain why a single UK house-price figure can be misleading. Mortgage costs, household earnings, the number and type of homes available, local job prospects, and purchase taxes all shape what buyers can pay and what sellers can achieve. Recent ONS figures are provisional, so they describe a broad national pattern, not the likely sale price of a particular home or a guaranteed forecast.
Destaques
The latest UK average was £273,000 in August 2026, with annual growth slowing to 0.9%.
Prices and annual growth differ by country, region, property type, and local supply.
The Bank of England reported a 4.63% effective rate on newly drawn mortgages and 53,400 purchase approvals for September 2026.
House-price indices measure different things: completed sales, mortgage approvals, or asking prices.
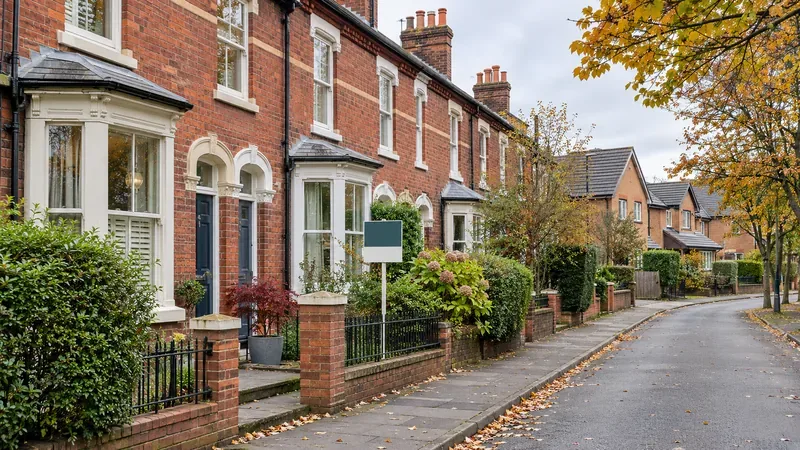
Illustrative UK residential street; the image does not show a specific listing or location.
What do the latest UK house-price figures show?
The ONS’s October 2026 bulletin uses UK House Price Index (UK HPI) data through August. Its provisional UK average of £273,000 was 0.9% higher than a year earlier, and the annual growth rate had slowed for a fourth consecutive month. The country figures show why national averages need context:
Country
Latest reference period
Average price
Annual change
England
August 2026
£294,000
+0.4%
Wales
August 2026
£216,000
+3.1%
Scotland
August 2026
£198,000
+2.9%
Northern Ireland
April–June 2026
£202,000
+9.2%
Northern Ireland’s figure is for the second quarter, while the other three are for August. Treat the different reference periods as a timing difference, not a same-month ranking. Within England, the North East had the fastest annual growth in August at 3.2%, while London prices were 2.2% lower than a year earlier. In London, flat prices fell 5.0% while house prices rose, showing how the mix of homes sold can move a regional average.
Recent UK HPI estimates are provisional and subject to revision. The initial August estimate was based on sales volumes reflecting about 53% of estimated Great Britain sales for that month. A later update may change the figure as more completed transactions are registered. The ONS’s next scheduled house-price release is November 18, 2026.
Which factors influence UK house prices?
Mortgage rates and access to credit
For many buyers, the mortgage payment—not just the listing price—sets the practical limit on a bid. A higher interest rate raises borrowing costs and can reduce the loan a household qualifies for. If rates ease, some buyers may be able to bid more, but the result depends on lender criteria, deposit size, income, existing debts, and the mortgage product available.
In its September 2026 Money and Credit release, published October 29, the Bank of England reported that the effective interest rate on newly drawn mortgages rose to 4.63%, from 4.60% in August. Net approvals for house purchases fell to 53,400 from 54,800. Approvals are an indicator of future borrowing, not a count of completed home sales. These figures show that borrowing conditions remained relevant to demand; they do not by themselves prove why prices changed.
Income, job security, and affordability
Household income affects the deposit people can save and the monthly payment they can sustain. ONS data published in October put median weekly earnings for full-time employees at £811.20 in April 2026, 5.8% higher than a year earlier in nominal terms and 2.7% higher after adjusting for inflation using CPIH. Those figures describe employees as a group; they do not represent every buyer’s take-home pay, household income, or ability to get a mortgage.
Affordability is often assessed by comparing a home price with earnings. The ONS’s 2025 England-and-Wales measure put the median price at 7.6 times median annual full-time earnings in England and 6.0 times earnings in Wales. This ratio is useful background, but it is not a mortgage quote and that particular release does not cover Scotland or Northern Ireland. Local wages, household size, deposit, and mortgage rates can change the picture for an individual area.
Supply, demand, and the type of home available
Prices can face upward pressure when more households want a certain kind of home than sellers or builders can supply. The shortage may be local or specific to family houses, flats, accessible homes, or homes near jobs and transit. Planning decisions, land availability, construction costs, infrastructure, and the pace at which approved projects are completed all affect how quickly supply can respond. England’s National Planning Policy Framework says planning should support a sufficient supply and mix of homes; planning permission alone does not mean a completed home is immediately available.
Demand also shifts with household formation, population, job opportunities, commuting patterns, and confidence about future income. A strong local labor market can attract buyers, while uncertainty or fewer available mortgages can cause households to wait. These forces interact: additional supply may moderate pressure in one town or property type without producing the same result across the whole UK.
Location, property condition, and market mix
Two homes in the same neighborhood can have different values because of size, condition, lease length, energy efficiency, outdoor space, transport links, schools, and nearby services. A regional average can also rise or fall because a different mix of homes sold during the month. The London contrast between falling flat prices and rising house prices in August is a current example: the reported regional average does not mean every home there moved in the same direction.
Taxes, transaction costs, and policy changes
Purchase taxes affect the total cost of moving and can influence whether a buyer proceeds, changes budget, or waits. Their names and rules differ across the UK: Stamp Duty Land Tax applies in England and Northern Ireland, Land and Buildings Transaction Tax in Scotland, and Land Transaction Tax in Wales. Changes to thresholds or surcharges can also shift when some transactions take place. Check the official rules for the nation where the property is located; do not assume the same tax applies throughout the UK.
How should readers compare house-price data?
First check what an index measures and when. The UK HPI is based on registered completed sales, so it provides a broad picture of achieved prices but arrives with a delay. Nationwide and Halifax use their own mortgage-approval data and therefore exclude cash purchases. Rightmove tracks asking prices, which are sellers’ initial expectations rather than final sale prices. Their monthly changes can differ without any one measure necessarily being wrong: they record different stages, homes, and transactions.
For a decision about one home or neighborhood, compare recent completed sales for similar property types and check how many transactions support the estimate. The HM Land Registry’s price-trend service and ONS local housing statistics can help locate local data. A national average is useful for context, but it cannot substitute for a current valuation or account for a home’s condition and legal details.
What could move the market next?
The latest official data confirm slower annual growth through August, not a certain fall ahead. Future prices will depend on how mortgage costs, incomes, job security, buyer confidence, available homes, and local demand change. If borrowing becomes more affordable while supply remains limited in a high-demand area, prices there could be more resilient; if buyers’ budgets tighten or more similar homes come to market, sellers may face more competition. Those are conditional mechanisms, not a forecast for every UK region.
For a fresh reading, watch the next UK HPI release scheduled for November 18, compare it with the Bank of England’s mortgage and approval statistics, and look at local completed sales rather than relying only on asking prices. Also note the reference month: official sale-price data can describe a market that has already changed by the time the report appears.
FAQ
Do mortgage rates affect UK house prices?
Yes. Mortgage rates affect monthly payments and how much many buyers can borrow, which can change demand. The effect varies with incomes, deposits, lender criteria, and local supply.
Is the UK average house price a good estimate for my area?
No. It is a national benchmark. Country, region, neighborhood, property type, condition, and the mix of homes sold can all produce very different local results.
Which UK house-price index should I follow?
Use the UK HPI for a broad measure based on completed registered sales, and note its publication lag. Asking-price and mortgage-approval indices can offer earlier signals but measure different parts of the market.