01. Historical Context
Why the next leg lower would matter more than a normal dip
Nifty 50 currently sits at 23,689.60 on May 14, 2026. The valuation anchor is 20.94x trailing P/E, 3.29x P/B and a 1.3% dividend yield as of April 30, 2026, and that is the first fact that should shape any forecast. A long-horizon article is only useful if it starts from the present setup rather than treating valuation as an afterthought.
| Horizon | What matters most | What would strengthen the thesis | What would weaken the thesis |
|---|---|---|---|
| 1-3 months | Price action versus revisions | Better breadth, calmer macro headlines, stable valuation | Narrow leadership, higher yields, weaker guidance |
| 6-18 months | Earnings delivery and policy transmission | Positive revisions and better domestic demand | Negative revisions, tighter liquidity, growth disappointment |
| To 2030 | Sustainable profitability and multiple discipline | Earnings compounding without a valuation blowout | Repeated de-rating, stalled profits, or structural policy drag |
India's March 2026 CPI inflation was 3.40% year over year and food inflation was 3.87%, while MoSPI's first advance estimate projected real GDP growth of 7.4% for FY2025-26. The IMF's April 2026 regional work still described Asia as the world's growth leader, while India remained one of the main drivers of that resilience despite higher energy-risk sensitivity. For Nifty 50, that macro corridor means the next cycle is likely to be driven less by storytelling and more by how earnings absorb rates, energy and policy shocks.
That is why the relevant question is not whether Nifty 50 can print an attention-grabbing number by 2030. The relevant question is which combination of earnings, valuation and liquidity would justify paying more than today. Reuters reported on May 5, 2025 that Goldman Sachs upgraded India to overweight and set a 2026 year-end Nifty 50 target of 29,000, citing stronger earnings momentum and policy tailwinds.
02. Key Forces
Five measurable forces that could drag the index lower
The downside case starts with valuation risk. 20.94x trailing P/E, 3.29x P/B and a 1.3% dividend yield as of April 30, 2026 financial services carried 35.27% of index weight in the April 2026 factsheet, followed by oil, gas and consumable fuels at 10.83% and IT at 8.58%. When the market is priced for follow-through, even decent data can trigger a reset.
Macro is the second control variable. India's March 2026 CPI inflation was 3.40% year over year and food inflation was 3.87%, while MoSPI's first advance estimate projected real GDP growth of 7.4% for FY2025-26. Markets can carry elevated multiples for longer when inflation is falling or contained, but not when the discount rate is rising faster than earnings.
Earnings and revisions are the third control variable. The strongest markets are the ones where analyst numbers stop falling before price leadership gets crowded. That matters especially for Nifty 50, because one-way narratives tend to break when estimate revisions do not confirm them.
Policy transmission is the fourth control variable. Reuters reported on May 5, 2025 that Goldman Sachs upgraded India to overweight and set a 2026 year-end Nifty 50 target of 29,000, citing stronger earnings momentum and policy tailwinds. For this index, the real issue is whether macro support reaches profits, credit growth, domestic demand or export volumes quickly enough to justify the next leg.
Positioning and breadth are the fifth control variable. A market can stay expensive longer than skeptics expect, but rallies driven by a small group of names are less durable than rallies confirmed by wider participation and sector rotation.
| Factor | Current assessment | Bullish read | Bearish read | Bias |
|---|---|---|---|---|
| Macro | India's inflation is below 4%, while real GDP growth is still running above most large economies. | Improving revisions, cleaner macro and valuation support | Revisions roll over or the multiple stops being supported | Bullish |
| Valuation | A 20.94x trailing P/E is not cheap enough to ignore execution risk. | Improving revisions, cleaner macro and valuation support | Revisions roll over or the multiple stops being supported | Neutral |
| Sector mix | Financials alone are 35.27% of weight, so credit quality and loan growth still dominate index earnings. | Improving revisions, cleaner macro and valuation support | Revisions roll over or the multiple stops being supported | Neutral |
| Domestic liquidity | Strong local participation continues to offset periods of foreign selling. | Improving revisions, cleaner macro and valuation support | Revisions roll over or the multiple stops being supported | Bullish |
| External risk | Oil, tariffs and rupee pressure remain the fastest ways to challenge the base case. | Improving revisions, cleaner macro and valuation support | Revisions roll over or the multiple stops being supported | Neutral to bearish |
The point of this table is not to force certainty. It is to show where the current balance of evidence leans today, not where a narrative would like it to lean.
03. Countercase
What would make the bear case stronger
The simplest way to break the thesis is to let the market trade above the evidence. 20.94x trailing P/E, 3.29x P/B and a 1.3% dividend yield as of April 30, 2026 means the next disappointment would matter more if earnings revisions stall or reverse.
A second risk is macro slippage. India's March 2026 CPI inflation was 3.40% year over year and food inflation was 3.87%, while MoSPI's first advance estimate projected real GDP growth of 7.4% for FY2025-26. If inflation or oil shocks force tighter financial conditions, the market will demand more proof from cyclical and duration-sensitive sectors.
A third risk is narrow leadership. Index-level performance often looks safer than it is when only a handful of sectors are carrying estimates, flows and sentiment at the same time.
A fourth risk is policy translation. Headline support only matters if it reaches profits, spending, trade volumes, or balance sheets. The market usually punishes the gap between official intent and realized earnings more than the headline itself.
| Investor type | Main risk | Suggested posture | What to monitor next |
|---|---|---|---|
| Already profitable | Giving back gains during a de-rating | Cut size into failed breakouts | Revisions breadth, yields, and valuation |
| Currently losing | Averaging into a thesis that has changed | Add only after trigger conditions improve | Forward estimates and policy follow-through |
| No position | Buying a weak setup too early | Wait for data confirmation or cheaper levels | Macro releases, breadth and support levels |
The countercase is strongest when it is dated and measurable. That is why valuation, inflation, revisions and policy transmission matter more here than broad claims about sentiment.
04. Institutional Lens
What institutional data would confirm the downside thesis
The institutional read should start with primary data rather than branding. For Nifty 50, the accessible high-quality sources are the official index provider or exchange, the relevant national statistical agencies, and the IMF's April 2026 baseline. The IMF's April 2026 regional work still described Asia as the world's growth leader, while India remained one of the main drivers of that resilience despite higher energy-risk sensitivity.
The second layer is market structure. Reuters reported on May 5, 2025 that Goldman Sachs upgraded India to overweight and set a 2026 year-end Nifty 50 target of 29,000, citing stronger earnings momentum and policy tailwinds. That matters because institutional investors typically change their weight only after revisions, liquidity and policy transmission move together.
When a named institution is useful here, it is because it provides a dated and measurable input. In this case, the relevant dated inputs include 20.94x trailing P/E, 3.29x P/B and a 1.3% dividend yield as of April 30, 2026, india's march 2026 cpi inflation was 3.40% year over year and food inflation was 3.87%, while mospi's first advance estimate projected real gdp growth of 7.4% for fy2025-26. and the IMF's April 2026 projections. That is a stronger foundation than attaching a bank name to a generic narrative.
| Source | Latest dated input | What it says | Why it matters |
|---|---|---|---|
| Index provider / exchange | 23,689.60 on May 14, 2026 | 20.94x trailing P/E, 3.29x P/B and a 1.3% dividend yield as of April 30, 2026 | Defines the current pricing starting point |
| Official macro data | March-April 2026 releases | India's March 2026 CPI inflation was 3.40% year over year and food inflation was 3.87%, while MoSPI's first advance estimate projected real GDP growth of 7.4% for FY2025-26. | Shows whether demand and inflation are helping or hurting the equity case |
| IMF | April 2026 | The IMF's April 2026 regional work still described Asia as the world's growth leader, while India remained one of the main drivers of that resilience despite higher energy-risk sensitivity. | Sets the broad macro corridor for base-case probabilities |
That is the practical value of institutional work: not false precision, but a disciplined list of the variables that actually deserve monitoring.
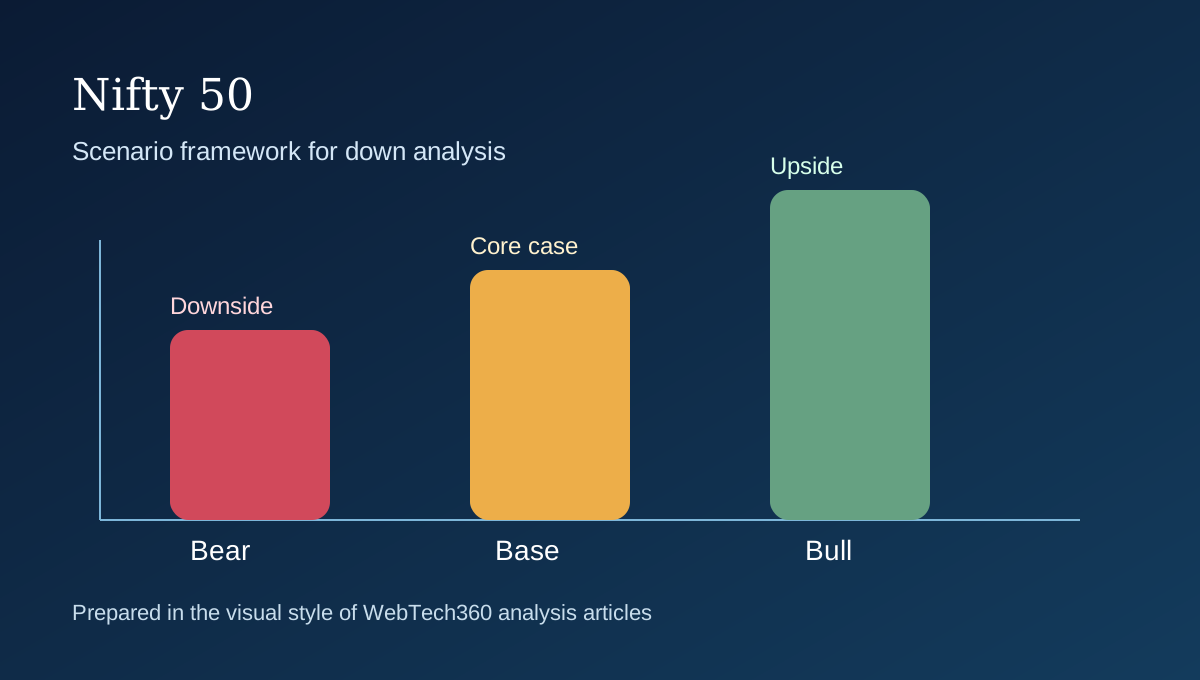
05. Scenarios
Actionable downside scenarios
The actionable bear setup is not every red day. It is a pullback that is confirmed by weaker revisions, weaker breadth and a less forgiving discount-rate backdrop.
If weakness is only mechanical and estimate cuts do not arrive, the market can stabilize quickly. If price weakness and revisions weakness appear together, preserving capital matters more than arguing with the tape.
The next review point should be the next inflation release, the next major central-bank meeting and the next reporting cycle, because that is where the downside case either gains evidence or loses it.
| Scenario | Probability | Trigger conditions | Review point |
|---|---|---|---|
| Controlled pullback | 35% | Valuation cools without a full earnings recession | Review after the next earnings and inflation cycle |
| Sideways repair | 35% | The market stops falling but fails to re-expand its multiple | Review if revisions flatten out |
| Deeper de-rating | 30% | Negative revisions and tighter liquidity arrive together | Review immediately if macro data and breadth worsen together |
These scenarios are not trading instructions. They are a framework for deciding when the evidence is getting stronger, when it is getting weaker, and when patience is the better position.
References
Sources
- Nifty 50 index page
- Nifty 50 factsheet, April 30 2026
- Reuters market close via MarketScreener, May 14 2026
- MoSPI CPI press release for March 2026
- MoSPI First Advance Estimates of GDP 2025-26
- Goldman Sachs upgrades India back to overweight; Reuters
- Reuters poll on Indian stocks, November 2025
- IMF Regional Economic Outlook for Asia and Pacific, April 2026