Home
» Wiki
»
How to Use Google Slides to Create a Diagram
How to Use Google Slides to Create a Diagram
When you think of Google Slides , you probably just imagine something you can use to design slides for your presentations. What you might not realize is that Google Slides is also great for creating diagrams, whether it's a flow chart, Venn diagram, or mind map.
Of course, there are plenty of other (more specialized) tools you can use to create diagrams, like Lucidchart and other Google Docs add-ons. But Google Slides is a great and viable option for a number of reasons.
One major advantage is real-time collaboration. If you’ve used Google’s suite of tools, you’ll know how easy it is to access projects from any device with an internet connection. This accessibility makes team collaboration easy; simply use the Share option to invite colleagues, give them editing or commenting access, and they can provide feedback or make changes to the diagram on the fly.
Google Slides also integrates seamlessly with Google Sheets, making it perfect if your diagrams need to incorporate data. By navigating to the Insert tab and selecting Chart > From Sheets or copying and pasting cells directly from Sheets, you can link your data so that any updates in your spreadsheet are reflected in your slides.
Plus, Google Slides is completely free, offering powerful features at no cost – all you need is a Google account. Unlike tools that require a subscription or have limited free features, Google Slides offers enough built-in tools to create polished, professional diagrams.
With shapes, lines, charts, and even basic AI support, creating and exporting your diagrams as JPEG, PNG, or SVG images is quick and intuitive. From basic shapes to more advanced features, Google Slides has a number of tools that can help you create great diagrams. Here are some of the most useful ones.
Shapes, arrows and lines
Every good diagram includes some basic shapes and connections, and Google Slides offers a ton of them. With these tools, you can create flow charts, Venn diagrams, and even some charts.
Because Google Slides allows you to group and ungroup elements on your slide, you can easily treat multiple elements as a single unit. This is especially useful when you need to move or resize parts of your diagram.
You can also click Order to change the layer of elements on the slide, bringing some elements to the front or moving them to the back, ensuring the diagram looks exactly how you want.
Integrated diagram template
Google Slides offers a number of solid diagram templates that you can use to get started quickly. These templates include pre-designed layouts for flowcharts, timelines, and process maps.
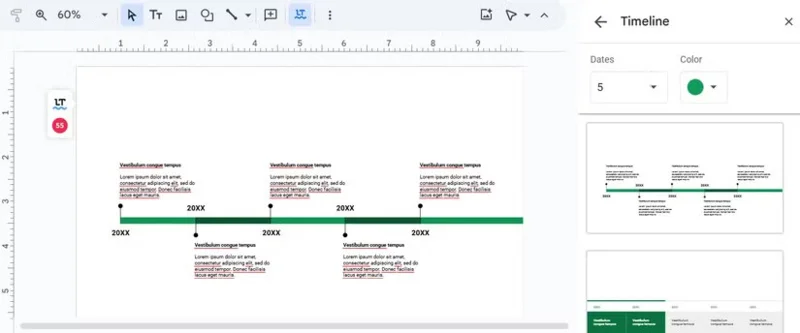
Click Insert > Diagrams > View all . Select the type of diagram you want, choose levels, dates, steps, or areas, and choose a color. Then, browse through the options and choose any template that looks like what you have in mind.
Diagram template inserted into Google Slides
You can then modify the diagram to suit your needs.
Add-ons for extra power
While Google Slides' native features are quite comprehensive, you can take advantage of add-ons like Lucidchart to extend its functionality.
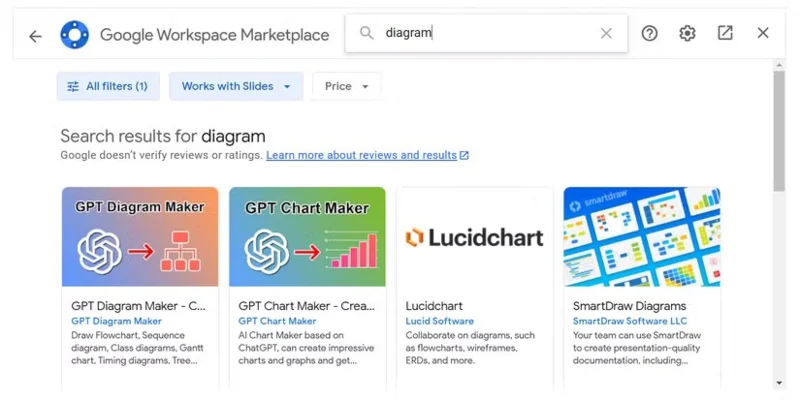
These add-ons integrate directly with Google Slides, allowing you to create more complex diagrams without leaving Slides. Click Extensions > Add-ons > Get add-ons and you'll find a bunch of relevant options.
Add-on options for Google Slides
Some of these add-ons have free plans, with paid plans for even more features.
Custom colors and additional fonts
You can apply solid or gradient colors to your shapes, and you have full control over the fonts and text styles in your diagram. This means you can match the look and feel of your diagram to your project guidelines or branding without any advanced design skills.
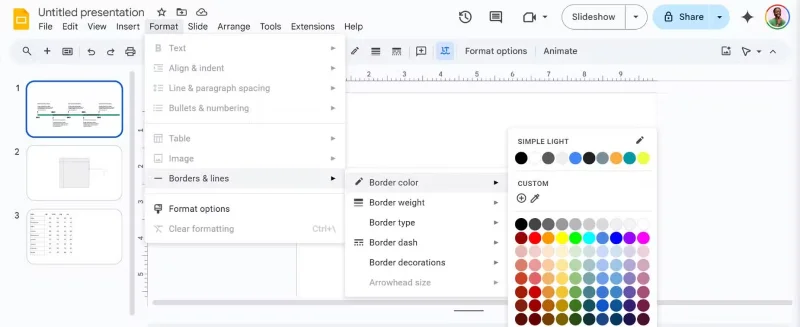
For example, to ungroup elements in a diagram, select a line and click Format > Borders & Lines > Border color . Then, click the plus icon under Custom to enter the hex code of the color you want.
Borders & Lines color formatting options in Google Slides
While you can't add custom fonts, you can still add additional fonts to Google Slides, so you have more font options than what's immediately accessible.
Gemini AI
If you're part of Google Workspace Labs, you'll have access to Gemini in Google Slides. Creating illustrations is one way to use Gemini AI in Slides.
This tool is not the best for creating charts and mind maps, but it is a pretty good tool for creating diagrams, as all you have to do is provide a detailed description of what you want.
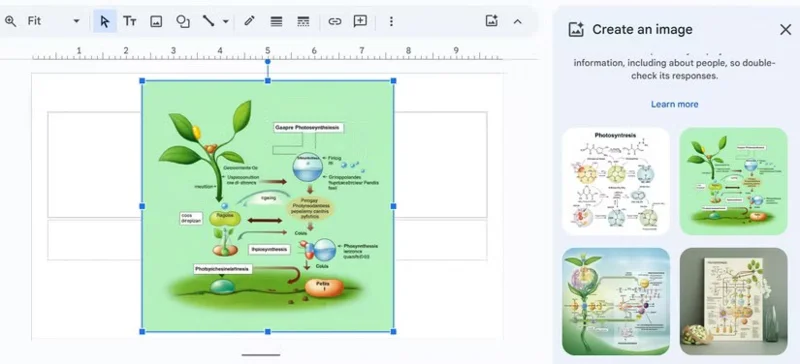
You can use Gemini AI by launching the Ask Gemini bar, but you may also have more success with the Create an image bar . Just be aware that your diagram will look more like an image than a chart, and the text may be unreadable as the AI has trouble writing text in images.
AI-generated diagram visualization feature
You can simply use Gemini AI to brainstorm ideas for your diagram, such as the best color combinations, shapes, and connections, to create what you have in mind.
Animations and transitions
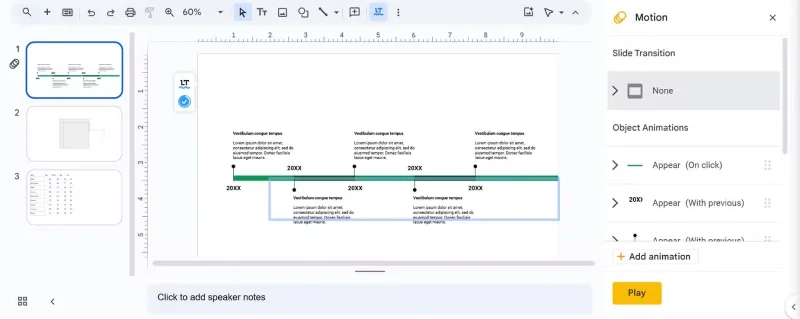
If you're creating a step-by-step flowchart or want to show the progress of a process, Google Slides animations and transitions can be extremely useful. You can animate each shape or element in your flowchart to appear one by one so your audience can follow the process in a structured way.
On your computer, just select the element you want to animate and click Insert > Animation . You can choose to have them fly in, shrink, or any other option you like.
Motion panels in Google Slides
Google Slides may not be the first tool that comes to mind when you need to create a diagram, but it actually has a lot more capabilities than that. So the next time you think about creating a diagram, don't overlook Google Slides!