Excel provides a variety of chart types including column and bar charts to present your data. However, you don't have to use the preset column and bar layouts. Instead, you can swap them out for chart-themed images or icons to grab people's attention. Here's how to use pictures as Excel chart bars .
Instructions for using images as Excel chart columns
Step 1:
First you create a chart in Excel as usual.

Next, you download the image and remove the background of the image . You should use the PNG image you want to replace the column in Excel. Next, use the image background removal feature in Excel to remove the background around the image.

Step 2:
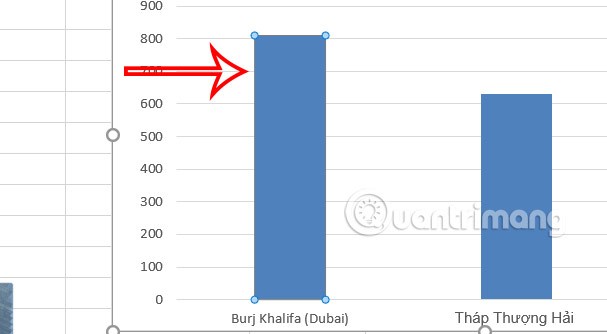
Click on the first image and press Ctrl+C to copy the image. Next, click on the first chart column twice , the first click will select all columns and the second click will isolate that column. Note that you do not double click. If you do it correctly, you will see the 4 sides of the column selected as shown below.
Step 3:
Now you just need to press Ctrl+V to paste the image to replace the column . The result is that you will see the image replace the Excel chart column.

We continue to paste the remaining images into the columns and get a new chart as shown below. The image automatically aligns to exactly match the height of each column in the Excel chart.

Video tutorial on using images to make Excel column charts


