Home
» Health
»
Companies Leading the Charge Against Climate Change: Six Models of Corporate Climate Action in 2026
Companies Leading the Charge Against Climate Change: Six Models of Corporate Climate Action in 2026
Corporate climate leadership is harder to judge than a slogan, a net-zero date, or a large renewable-energy purchase. Companies operate in different industries, control different parts of their emissions, and face very different technical constraints. A software company, a shipping line, and a renewable-power developer should not be measured with one simplistic score.
As of September 2026, a more useful question is: what kind of climate problem is each company actually solving, how much measurable progress has it disclosed, and what tradeoffs remain? The six companies below are not presented as a definitive global ranking. They are selected examples of distinct approaches that are useful to compare.
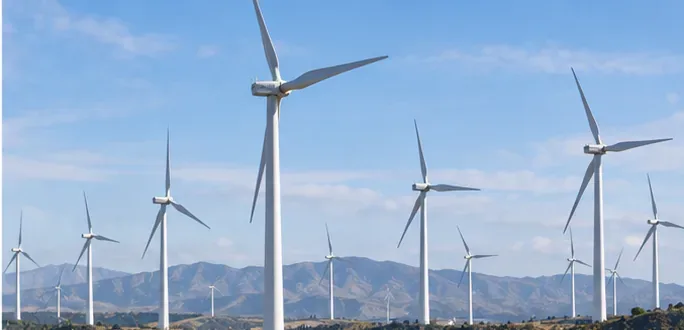
Utility-scale wind power represents one of the core tools companies use to cut electricity-related emissions and support wider grid decarbonization.
First, know what the numbers mean
Corporate greenhouse-gas inventories are usually organized into three categories. Scope 1 covers direct emissions from sources a company owns or controls. Scope 2 covers indirect emissions from purchased electricity, steam, heating, or cooling. Scope 3 covers other value-chain emissions, such as purchased materials, logistics, business travel, suppliers, or the use of sold products. The GHG Protocol is the main reference framework behind these definitions.
This distinction matters because a company can make impressive progress in its offices and data centers while most of its footprint remains in manufacturing, customer use, fuel, construction materials, or suppliers. It also matters because avoided emissions are not the same thing as a reduction in a company’s own inventory. Avoided-emissions estimates compare a real-world outcome with a counterfactual scenario and can be useful, but they should be read separately from Scope 1, 2, and 3 totals.
A quick comparison of six climate-action models
Company
Where its climate case is strongest
Latest disclosed signal
Main tradeoff to watch
Ørsted
Transforming a fossil-heavy utility into a renewable-energy business
99% renewable energy generation in 2025; Scope 1–2 emissions intensity down more than 98% from 2006
Scope 3 remains substantial, especially materials, construction, transport, and value-chain activity
Apple
Driving emissions cuts through product design and a global manufacturing supply chain
2025 emissions remained more than 60% below the 2015 baseline
Manufacturing and product use still dominate the footprint; the final 2030 gap is harder than early reductions
Google
Large-scale clean-power procurement and climate-related digital products
More than 12 GW of net-new clean energy contracted in 2025
AI and data-center growth increase electricity demand; avoided-emissions claims are not the same as inventory reductions
Microsoft
Building markets for carbon removal and carbon-free electricity
100% of annual global electricity consumption matched with renewable energy in FY25
Total Scope 1–3 emissions rose 25% year over year in FY25 amid data-center expansion and accounting changes
Schneider Electric
Helping industrial and commercial customers use less energy and electrify
862 million metric tons of customer emissions reported as saved and avoided since 2018
Customer avoided emissions are methodology-dependent and should not be netted against Schneider’s own footprint
Maersk
Attempting to decarbonize a hard-to-abate global shipping system
10 new dual-fuel methanol vessels added in 2025; 640 fuel-saving initiatives across 380 vessels
Total emissions increased 2% in 2025, illustrating how difficult fuel and routing constraints remain
Ørsted: the clearest business-model transformation
Ørsted stands out because its climate story is not mainly about making an existing fossil-heavy business slightly more efficient. The Danish energy company spent years moving away from coal and toward offshore wind and other renewables. In its latest full-year disclosure, Ørsted reported that renewable energy represented 99% of its generation in 2025 and that Scope 1 and 2 emissions intensity had fallen by more than 98% from a 2006 baseline. Its 2025 annual report also lists 18.5 GW of installed renewable capacity.
The tradeoff is that operational decarbonization does not eliminate the footprint of building renewable infrastructure. Ørsted reported 8.8 million metric tons of Scope 3 emissions in 2025, with important sources including capital goods, fuel and energy activities, the use of sold products, steel, shipping, copper, and other supply-chain inputs. That makes Ørsted a useful example of a company that has largely solved one layer of the problem and is now confronting the harder value-chain layer. See Ørsted’s 2025 annual reporting and its decarbonization roadmap.
Best comparison lens: choose Ørsted when you want to evaluate whether a company has actually changed what it sells and builds, not just how efficiently it runs headquarters.
Apple: a strong test of supply-chain decarbonization
Apple’s climate challenge is very different. Its own offices and stores are a small part of the total footprint; product manufacturing, materials, logistics, and product use matter far more. Apple’s 2026 Environmental Progress Report says its 2025 greenhouse-gas emissions remained more than 60% below 2015 levels, even as revenue had grown 78% over that period. The company’s 2030 strategy is to reduce emissions by 75% from the 2015 baseline before balancing remaining emissions with carbon removals.
The report shows why this is difficult: product manufacturing accounted for 53% of Apple’s 2025 gross footprint, product use 27%, and product transportation 16%. That means supplier electricity, low-carbon materials, semiconductor processes, shipping, and device energy use are central to whether the goal is achieved. Apple also reported that its Supplier Clean Energy Program generated more than 38 million megawatt-hours in 2025.
The tradeoff is the remaining gap. A company can make large early reductions by switching electricity, improving materials, and changing supplier practices, but the residual emissions are often the most technically and commercially difficult. Apple’s progress is therefore most useful as a case study in how much influence a major buyer can exert over a manufacturing ecosystem. Read the Apple 2026 Environmental Progress Report.
Best comparison lens: choose Apple when you care about product life-cycle emissions, supplier leverage, recycled materials, and how a consumer brand translates purchasing power into manufacturing changes.
Google: clean-energy scale plus climate-enabled products
Google’s 2026 Environmental Report says the company contracted more than 12 GW of net-new clean energy in 2025, its largest annual procurement total. It also reports more than 58 million metric tons of emissions avoided across operations and the supply chain through measures including hardware efficiency, software efficiency, compute efficiency, and clean-energy procurement. Separately, Google estimates that nine products and services enabled 41 million metric tons of emissions reductions for users, cities, and partners in 2025.
Those numbers demonstrate scale, but they need careful interpretation. Google explicitly notes that avoided emissions are calculated against scenarios in which specific actions did not occur. They are not interchangeable with the company’s own greenhouse-gas inventory. The same report frames rapid growth and environmental stewardship as a tension, which is especially relevant as AI workloads expand data-center electricity demand.
Google is therefore a useful example of two climate strategies running in parallel: reducing the impact of its own computing infrastructure and using products such as routing, thermostats, solar analysis, and grid tools to influence emissions outside the company. See the Google 2026 Environmental Report.
Best comparison lens: choose Google when you want to examine whether digital companies can pair rapidly growing compute demand with large clean-power purchases, efficiency gains, and customer-facing climate tools.
Microsoft: ambitious market-building, but a visible AI-era emissions challenge
Microsoft is one of the most instructive companies to watch because its progress and its setbacks are both unusually visible. In FY25, Microsoft matched 100% of its annual global electricity consumption with renewable energy. It also reported that since 2020 it had contracted 40 GW of new renewable-energy supply and 29.8 million metric tons of carbon removal.
At the same time, Microsoft disclosed that total Scope 1, 2, and 3 emissions increased 25% year over year in FY25. The company attributed the increase mainly to data-center expansion and to pausing the use of non-additional, unbundled renewable-energy certificates while prioritizing investments intended to add new carbon-free electricity to grids. Scope 3 remained the largest share of the footprint, while Scope 2 rose sharply as a share of reported emissions.
This is an important tradeoff rather than a footnote. Annual renewable matching does not mean every data center is powered by carbon-free electricity every hour. And investing in carbon removal does not remove the need to reduce gross emissions first. Microsoft’s climate case is strongest where it uses long-term procurement to help build markets for renewable power, low-carbon materials, and durable carbon removal—but its AI infrastructure growth makes the 2030 carbon-negative goal materially harder. See Microsoft’s 2026 Environmental Sustainability Report overview.
Best comparison lens: choose Microsoft when you care about carbon-removal market development, corporate clean-energy procurement, and the real tension between AI growth and climate targets.
Schneider Electric: climate impact through customers and suppliers
Schneider Electric is different again because its business sells energy-management, automation, electrification, and efficiency technologies. The company reported 862 million metric tons of customer emissions saved and avoided cumulatively since 2018 through its solutions and services. It also reported that its market-based Scope 1 and 2 emissions fell 57% from 2021 to 2025, while Scope 3 emissions fell 12% over the same period.
The most interesting part of Schneider’s case is leverage. If a factory, data center, building, or utility uses less energy because of controls, drives, software, or electrification equipment, the climate impact can be larger than Schneider’s direct footprint. The company also says emissions from its top 1,000 suppliers have fallen substantially through its Zero Carbon Project.
But “saved and avoided” customer emissions should be treated as a separate performance category, not subtracted from Schneider’s own emissions. The methodologies involve assumptions about product lifetimes, energy savings, baseline technologies, and future grid carbon intensity. Schneider’s own disclosure acknowledges that Scope 3 remains far larger than its direct operational emissions. See Schneider Electric’s ESG strategy and climate disclosures.
Best comparison lens: choose Schneider Electric when you want to assess companies whose main climate contribution may come from enabling other businesses to electrify and improve energy efficiency.
Maersk: leadership in a sector where the easy options do not exist
Shipping is a useful stress test for corporate climate claims because large ocean vessels cannot simply plug into the grid while crossing oceans. Maersk’s current strategy combines efficiency, fleet upgrades, electrification on land, and lower-emission fuels. In 2025, the company added 10 new dual-fuel methanol vessels and completed 640 fuel-saving initiatives across 380 owned and time-chartered vessels.
Yet Maersk’s total greenhouse-gas emissions increased 2% in 2025, from 83.5 million to 85.4 million metric tons of CO2e. Scope 1 stayed roughly flat, Scope 2 fell 12%, and Scope 3 rose. Maersk cited longer routes around the Cape of Good Hope, increased air-cargo activity, third-party fuel and container sales, and fleet changes as contributors. Its 2030 targets include a 35% absolute reduction in Scope 1 emissions, 100% renewable electricity sourcing for Scope 2, and a 22% absolute reduction in Scope 3 emissions from a 2022 base year.
This is exactly why hard-to-abate sectors deserve a different lens. A shipping company that is testing new fuels, redesigning ships, improving route efficiency, and building demand for lower-emission fuels may be doing important transition work even if near-term absolute emissions do not fall smoothly every year. See Maersk’s 2025 climate performance and transition plan.
Best comparison lens: choose Maersk when you care about whether companies are confronting the physical and economic constraints of decarbonizing transport rather than relying on relatively easy electricity substitutions.
How should you decide which company is really leading?
The answer depends on what you are trying to learn or influence. A buyer selecting a cloud provider should pay close attention to electricity procurement, data-center efficiency, hourly carbon-free energy, and transparent Scope 3 reporting. A manufacturer choosing suppliers should care more about low-carbon materials, process emissions, supplier targets, and product life-cycle data. An investor assessing transition risk should look for absolute emissions trends, capital allocation, target credibility, and whether the business model can still compete as carbon constraints tighten.
If you care about changing the core business model: Ørsted is the most instructive case in this group.
If you care about consumer-electronics supply chains: Apple offers detailed evidence across materials, suppliers, product use, and logistics.
If you care about clean-power procurement at digital scale: Google and Microsoft provide useful but different models.
If you care about enabling industrial decarbonization: Schneider Electric shows how equipment and software can create customer-side impact.
If you care about hard-to-abate transport: Maersk is valuable precisely because its progress is constrained by fuel availability, vessel lifetimes, infrastructure, and regulation.
Five mistakes to avoid when comparing corporate climate claims
1. Treating a net-zero target as proof of progress
A target is a commitment, not an outcome. Look for year-by-year absolute emissions, not just a distant 2030 or 2040 promise.
2. Comparing intensity reductions with absolute reductions
Emissions intensity can improve while total emissions rise if a company grows quickly. Both measures can be useful, but they answer different questions.
3. Ignoring Scope 3
For many technology, consumer, industrial, and logistics companies, value-chain emissions dominate the footprint. A company that discusses only offices and purchased electricity may be leaving out the largest part of the problem.
4. Mixing avoided emissions with inventory reductions
Avoided-emissions estimates can show the effect of products or interventions, but they are usually counterfactual calculations. Read the methodology and keep them separate from Scope 1, 2, and 3 accounting. The GHG Protocol now provides dedicated guidance on estimating and reporting avoided emissions.
5. Assuming renewable-energy matching means carbon-free power every hour
Annual renewable procurement and hourly carbon-free operation are different claims. A company can buy enough renewable energy over a year to match annual consumption while still drawing power from fossil-heavy grids at specific times and locations.
The bottom line
No single company in this comparison “wins” corporate climate action across every dimension. Ørsted offers a powerful example of business-model transformation. Apple demonstrates sustained pressure on a global manufacturing supply chain. Google combines very large clean-power procurement with climate-related digital products. Microsoft is trying to build markets for clean electricity and carbon removal while confronting rapidly rising AI infrastructure demand. Schneider Electric’s strongest contribution may be the emissions its customers can avoid through electrification and efficiency. Maersk shows what transition looks like when low-carbon substitutes remain scarce, expensive, and infrastructure-dependent.
The most credible climate leaders are not necessarily the companies with the boldest headline. They are the ones that disclose the difficult numbers, distinguish reductions from removals and avoided emissions, invest in physical changes to their operations and supply chains, and keep updating their plans when growth or technology makes the original path harder.