Home
» Technology
»
Data-Driven Urban Planning: Building Sustainable and Walkable Smart Cities
Data-Driven Urban Planning: Building Sustainable and Walkable Smart Cities
A smart city is not simply a city with more sensors, apps, or dashboards. The more useful idea is a city that can observe what is happening, understand who is being served or left out, test changes, and learn from the results. Data-driven urban planning makes that possible by combining evidence about streets, land use, transit, climate, safety, public space, and residents' daily needs.
This matters because urban performance is still uneven. In the United Nations' 2026 reporting on Sustainable Development Goal 11, data from 412 cities across 127 countries showed that convenient access to public transport increased from 53.2% in 2020 to 61.5% in 2025. Yet a separate sample of 414 cities across 126 countries showed that convenient access to open public spaces fell from 48.0% to 45.9% over the same period. Those figures are not a scorecard for every city, but they illustrate why planners need more than a citywide average: progress in one system can happen while another part of urban life gets worse. See the United Nations Goal 11 data and targets.
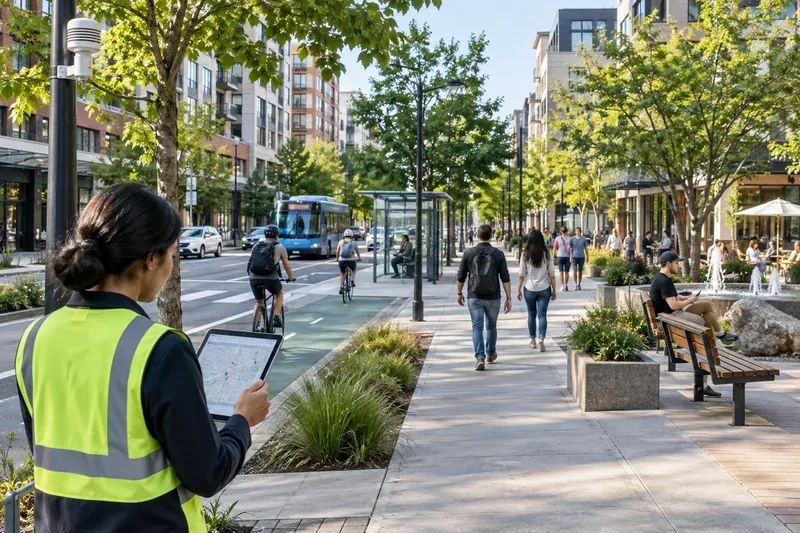
A walkable smart-city corridor combines everyday destinations, safe walking and cycling space, transit, shade, public space, and data collection that supports planning rather than replacing community input.
What data-driven urban planning actually means
Data-driven urban planning is the use of measurable evidence to decide where urban investments should go, how designs should change, and whether those changes are working. The key word is not data; it is decision. A city can collect millions of records and still make weak decisions if the data are poorly defined, biased, disconnected, or unrelated to a public goal.
Several terms appear frequently in smart-city projects. Geospatial data is information tied to a location, such as a crosswalk, bus stop, parcel, crash, tree, or building permit. A geographic information system (GIS) is software used to map and analyze that location-based information. The Internet of Things (IoT) refers to connected physical devices, such as traffic counters or environmental sensors, that can transmit data. A digital twin is a digital representation of a physical place or system that is updated with real or modeled data. Digital twins can be useful, but a city does not need one to begin evidence-based planning.
For walkability, it is also important to distinguish mobility from accessibility. Mobility describes how easily people move. Accessibility describes how easily people can reach jobs, schools, shops, parks, health care, transit, and other destinations. A street can move cars quickly while offering poor accessibility to someone walking. Sustainable planning focuses on the ability to reach what matters, not just on vehicle speed.
What a beginner should know before choosing technology
Start with people and outcomes, not a platform
UN-Habitat's people-centered smart-city work emphasizes that technology should support quality of life, inclusion, sustainability, resilience, and human rights rather than becoming the goal itself. Its 2025 playbook for governments organizes smart-city strategy around institutional foundations, participation, digital rights, governance, infrastructure, budgeting, implementation, and monitoring. That is a useful order of operations for any city: decide what problem matters before deciding what software to buy. The UN-Habitat 2025 people-centered smart city strategy playbook provides the original framework.
Walkability is a network property
A good sidewalk on one block does not make a neighborhood walkable. People need a connected network of sidewalks and crossings, useful destinations within practical reach, safe speeds, shade or weather protection where relevant, accessible curb ramps, and links to public transit. A missing crossing at one arterial road can break an otherwise strong network.
Public-health agencies also treat active mobility as an urban-planning issue. The World Health Organization notes that walking- and cycling-friendly design can support physical activity while also contributing to quieter streets, better air quality, and lower transport emissions. The WHO overview of healthy active mobility explains the connection between transport, urban design, health, and climate.
Citywide averages can hide unequal conditions
An average sidewalk coverage rate can look acceptable even if low-income neighborhoods, older residents, children, or people with disabilities face the largest gaps. For that reason, every major indicator should be segmented by geography and, where legally and ethically appropriate, by population characteristics. The purpose is not to label communities. It is to find where infrastructure and service outcomes differ.
What to prepare before analysis begins
A city does not need a perfect data warehouse to start. It does need a shared problem definition, a geographic unit of analysis, a baseline, and clear rules for using data. A practical starter package includes planning, transportation, public works, public health, sustainability, IT, and community-engagement staff. It should also include people who understand procurement, privacy, accessibility, and local law.
Planning outcome
Example measure
Possible data sources
Equity question
Walkable access
Share of homes within a safe walking route to daily destinations
Street network, land use, schools, shops, parks, transit stops
Which neighborhoods have the longest or least accessible routes?
Safer streets
Serious pedestrian and cyclist injuries; crossing delay; operating speeds
Does service frequency match the needs of shift workers and households without cars?
Heat resilience
Shade, tree canopy, surface temperature, cooling access
Remote sensing, tree inventory, weather sensors, public facilities
Where do high heat exposure and high pedestrian activity overlap?
Public-space quality
Access, comfort, use by time of day, maintenance issues
Park inventory, field audits, surveys, service requests
Who uses the space, and who reports barriers or avoids it?
Before combining these sources, write a simple data dictionary that defines each field, geographic scale, update frequency, owner, and known limitation. A key performance indicator (KPI) is a measurable value used to track an outcome over time. The United for Smart Sustainable Cities initiative, coordinated by the International Telecommunication Union and other UN bodies, provides a standardized KPI framework for cities. The U4SSC smart sustainable city KPI framework is a useful reference for teams that need comparable definitions rather than inventing every metric from scratch.
How data becomes a better street, neighborhood, or district
Build a baseline that reflects daily life
Begin by mapping the existing street network and the places people need to reach. Include sidewalks, crossings, transit stops, schools, clinics, parks, grocery stores, major employers, public buildings, and other locally important destinations. Then add barriers such as highways, steep slopes, missing curb ramps, long crossing distances, construction zones, or unsafe intersections.
For walking analysis, use actual pedestrian routes instead of simple circles around destinations. A school that is 400 yards away in a straight line may be a much longer walk if a railway, river, fenced property, or high-speed road blocks the direct route.
Combine objective data with lived experience
Sensor counts and administrative records are valuable, but they answer only part of the question. A pedestrian counter can show that few people walk along a corridor; it cannot by itself tell you whether the cause is heat, fear of traffic, poor lighting, harassment, missing destinations, inaccessible sidewalks, or simply low demand. Surveys, walking audits, workshops, interviews, and observations help interpret the numbers.
This is where the idea of a people-centered smart city becomes practical. Data should help planners ask better questions of residents, not replace them. If community feedback conflicts with a dashboard, investigate the difference rather than assuming the dashboard is correct.
Prioritize accessibility gaps, not just congestion
Traditional transport analysis often starts with traffic delay. A walkable-city analysis asks different questions: How many essential destinations can a resident reach safely without a car? How long does it take? Is the route comfortable in hot weather? Does it work for a wheelchair user or a parent with a stroller? Can someone walk to frequent transit without crossing a dangerous road?
Land-use and transportation planning should be evaluated together. The U.S. Environmental Protection Agency notes that when homes, jobs, stores, civic buildings, and transit are located near one another, people gain more practical options to walk, bike, or use public transportation. Its Smart Growth and Transportation guidance summarizes the connection between compact development, transportation choice, emissions, and community health.
Test changes at a scale where results can be measured
Not every intervention needs to begin as a large capital project. Cities can test shorter crossing distances, protected bike connections, curb-management changes, bus-priority treatments, shade, seating, loading zones, school-street restrictions, or new public-space layouts before committing to a permanent design. The test should have a defined hypothesis and baseline.
For example: if a crossing is shortened and vehicle speeds are reduced, the city might expect lower crossing time, fewer conflicts, and more people willing to walk. Measure before and after, and compare conditions at similar times and seasons. If possible, include a comparison corridor so that broader changes in weather, school schedules, tourism, or fuel prices are less likely to be mistaken for the effect of the project.
Measure more than one outcome
A successful smart-city project should not optimize one metric while damaging another. A bus-priority lane may slightly increase delay for private vehicles while greatly improving transit reliability and access. A pedestrian plaza may reduce through-traffic but increase local footfall, shade, and public-space use. A data-driven evaluation should make these tradeoffs visible.
Useful measures can include walking and cycling counts, transit travel time, injury severity, operating speed, tree canopy, surface temperature, air quality, retail vacancy, public-space use, accessibility for disabled users, and resident satisfaction. Modal share means the percentage of trips made by each mode, such as walking, cycling, transit, or driving. It can be useful, but it should not be the only measure because trip distance, destination access, and demographic differences also matter.
Data governance is part of urban design
Data governance means the rules, roles, standards, and controls that determine how data are collected, stored, shared, protected, and used. It is not an administrative afterthought. Poor governance can undermine public trust even when the technical analysis is sound.
The OECD's 2023 study of smart-city data governance identifies recurring challenges including fragmented responsibilities, limited skills, financing constraints, data-sharing barriers, privacy concerns, security risks, and interoperability problems. Interoperability means that different systems can exchange and use information consistently. The OECD Smart City Data Governance report recommends clearer strategies and structures, stronger data-management practices, privacy and transparency safeguards, cooperation across organizations, and stakeholder participation.
For beginners, a sensible rule is to collect the minimum data necessary for the planning question. Aggregate or anonymize personal data where possible, define retention periods, document who can access sensitive information, and avoid collecting precise individual movement histories simply because a vendor can provide them. Procurement contracts should also clarify data ownership, export rights, security obligations, and what happens when a contract ends.
Common mistakes that weaken smart-city planning
Buying technology before defining the problem. A citywide sensor network is not a strategy. Start with the outcome, then decide whether new data are actually needed.
Using traffic volume as the main proxy for success. Vehicle throughput says little about whether people can safely reach everyday destinations.
Treating missing data as zero. No pedestrian count may mean no sensor was installed, not that no one walks there.
Ignoring data bias. App-based mobility data can underrepresent people who do not carry smartphones, opt out of tracking, or cannot afford certain services.
Optimizing citywide averages. A small improvement in already well-served areas can hide worsening conditions elsewhere.
Measuring only after construction. Without a baseline, it is difficult to know whether the project caused the observed change.
Confusing correlation with causation. If walking rises after a new park opens, other factors such as new housing, seasonal weather, or transit changes may also contribute.
Building a dashboard nobody owns. Every KPI needs a responsible department, an update schedule, and a decision process tied to the result.
Underestimating maintenance. Sidewalk quality, tree health, sensors, signage, lighting, and public-space cleanliness all deteriorate without operating budgets.
Leaving residents out of interpretation. Local knowledge often explains anomalies that administrative datasets cannot.
How to tell whether the planning system is getting smarter
A city is becoming smarter when its planning process improves, not when its technology inventory grows. A useful self-check is to ask whether the city can answer four questions with current evidence: Where are the largest accessibility and safety gaps? Which groups experience them most? What intervention is expected to improve the situation? Did conditions actually improve after implementation?
Good programs also show institutional learning. Definitions stay consistent from year to year. Data sources are documented. Privacy rules are clear. Community input changes priorities when evidence supports it. Pilot results influence capital budgets. Failed experiments are recorded rather than hidden. And successful interventions can be scaled because the city knows why they worked.
For a beginner, the most important lesson is simple: do not try to make the city “smart” all at once. Pick one real outcome, such as safer school access or better walking connections to frequent transit. Build a trustworthy baseline, combine quantitative data with community knowledge, test a focused intervention, measure the result, and repeat. That cycle is the foundation of sustainable, walkable, data-driven urban planning.