Home
» Technology
»
How to Check if Salesforce Is Experiencing a Global Outage
How to Check if Salesforce Is Experiencing a Global Outage
Verified September 16, 2026. When Salesforce suddenly stops loading, returns repeated errors, or leaves records and dashboards spinning, the fastest way to find out whether the problem is global is to check Salesforce’s own Trust Status information before changing your local setup.
A Salesforce outage is not automatically global. Salesforce runs many products, regions, and customer instances, so one organization can be unavailable while another is operating normally. The practical test is to compare the overall product status with the status of your own instance, then rule out a browser, network, identity-provider, or configuration problem.
Quick answer: where should you check first?
Start with Salesforce Trust Status. It is Salesforce’s central status page for current service events and instance availability. The site can show product-level information, while an instance page tells you whether the org you use is available, degraded, disrupted, or under maintenance.
Do not rely on a search-engine snippet, a social-media post, or a third-party outage tracker as your final confirmation. Those sources can be useful signals, but Salesforce’s own status information is the authoritative place to confirm scope and updates.
Important: live status changes quickly. This article explains the verification method and was checked on September 16, 2026; it does not claim that a status seen at one moment will remain unchanged later.
Step 1: Open the Salesforce Trust Status page
Open status.salesforce.com in a separate tab. You do not need to keep refreshing Salesforce itself while you check. Look first for any current incident, service disruption, performance degradation, informational message, or maintenance notice.
At this level, ask a scope question: does the notice affect a broad Salesforce product or many instances, or does it point to one tenant, region, cloud, or component? A broad notice is stronger evidence of a Salesforce-side event, but you still need to check your own instance because product status and org status are not always identical.
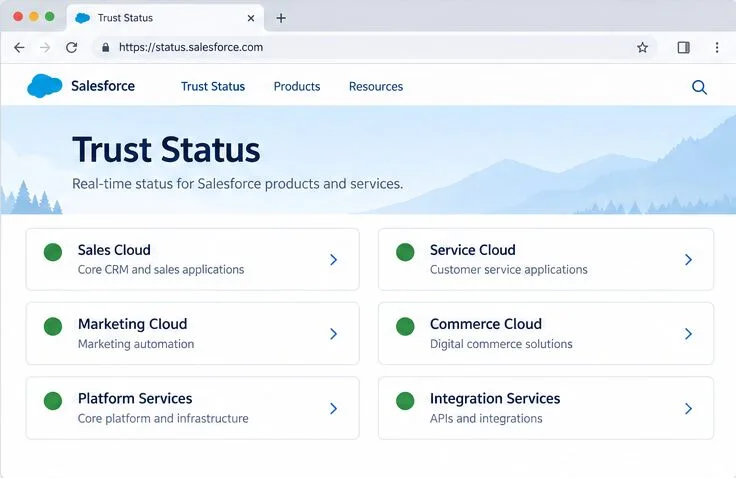
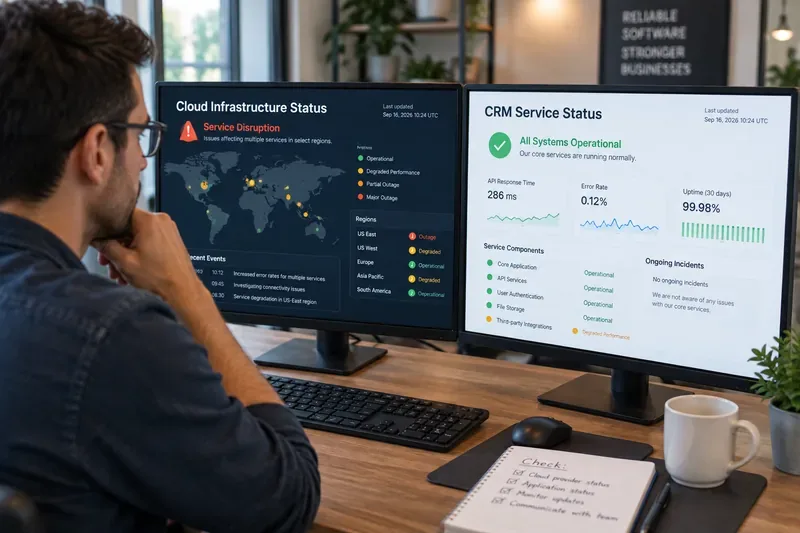
Step 1 — Begin with the Trust Status overview. The interface shown is an illustrative reference for locating product-level status information, not a live status screenshot.
Step 2: Find your Salesforce instance or My Domain
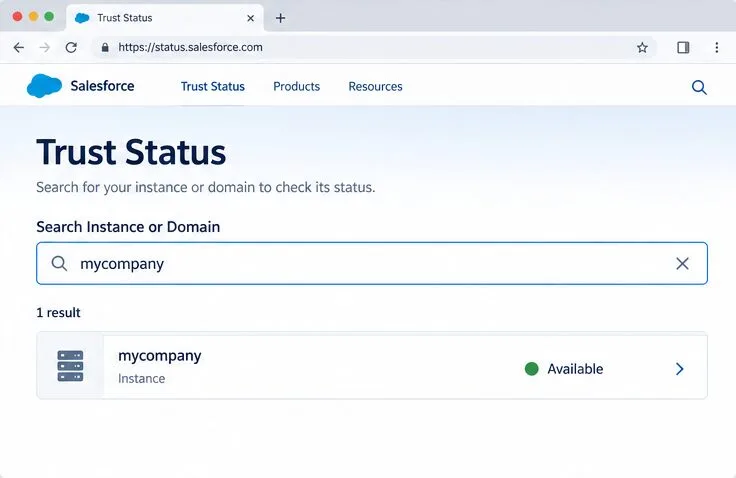
On the Trust Status page, use the search field for your instance or domain. Salesforce’s documentation says you can enter your My Domain name. For example, if your login address is https://example.my.salesforce.com, the value to search is example, not the full URL.
If you are an administrator and can still reach Setup, you can find the instance another way:
Open the gear menu and select Setup.
In Quick Find, search for Company Information.
Open Company Information and read the Instance field.
Salesforce also documents a My Domain route through Setup. The key point is to identify the org that is actually failing rather than checking a different sandbox, production org, or connected service by mistake.
Step 2 — Search for the My Domain prefix or instance name. Use the identifier for the affected org, not a complete login URL.
Step 3: Read the instance status and incident details
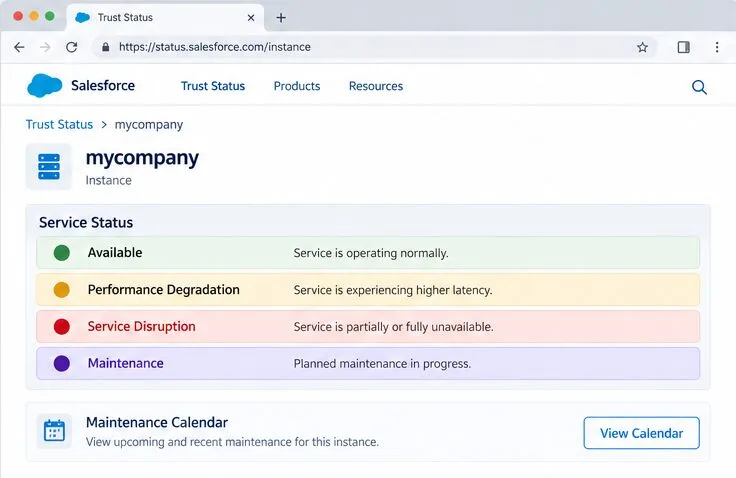
Select the matching instance and read the overall status. Salesforce defines the main availability states as follows:
Status
What it means
What to do next
Available
The instance and its services are available.
Continue with local and org-level troubleshooting if you still cannot work.
Performance Degradation
The instance is accessible, but one or more services are slower or not operating at optimal performance.
Open the incident details and note the affected function and latest update.
Service Disruption
The instance is unavailable to customers.
Record the incident number and follow Salesforce’s updates rather than repeatedly changing your configuration.
Maintenance
The instance is undergoing planned maintenance.
Check the maintenance window and whether access is expected to be affected.
Click the incident number or event message when available. Note the start time, affected product or service, region, latest update, and whether Salesforce is investigating, mitigating, or resolving the issue. A red or disruption status on your instance confirms an availability problem for that instance; it does not, by itself, prove that every Salesforce customer worldwide is offline.
Step 3 — Read the instance-level status and open the incident or maintenance details. The labels mirror Salesforce’s documented status categories; the page shown is illustrative.
How can you tell whether the outage is global?
Use a two-level comparison:
Product-level check: the Trust overview shows whether Salesforce is reporting an event affecting a product or service broadly.
Instance-level check: your org page shows whether your tenant is available, degraded, disrupted, or under maintenance.
If the product-level page and your instance page both show an incident, and users in different locations or orgs report the same behavior, a Salesforce-side or multi-region event becomes more likely. If only your instance is affected, the problem may be limited to that org, region, feature, or maintenance window. If Trust is green but only one user cannot log in, a global outage is less likely.
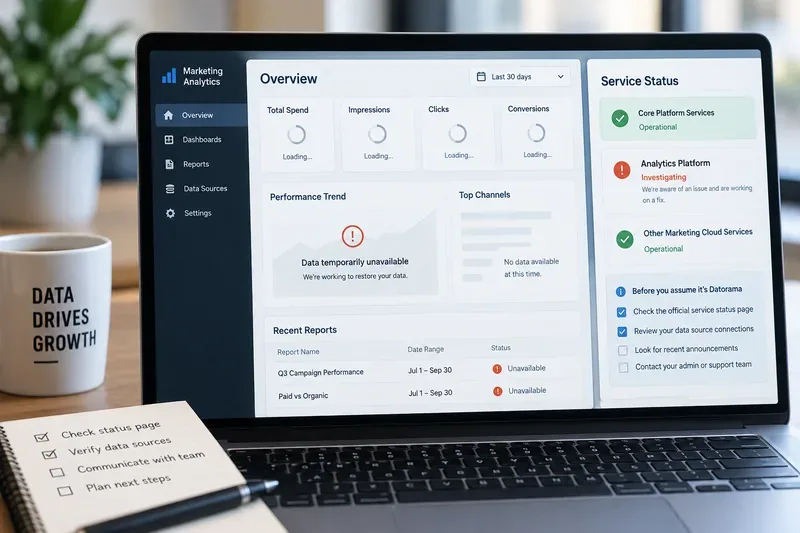
Salesforce advises customers with issues in services such as Marketing Cloud, Heroku, Data.com, Salesforce IQ, Social Studio, or Account Engagement to use the corresponding service status page from the Trust site. Do not assume that the core Salesforce status page covers every Salesforce-branded service in exactly the same way.
Step 4: Rule out a local problem
If your instance is shown as Available, work through the easiest checks before escalating:
Refresh the page once and retry in a private or incognito window.
Try a supported alternate browser, without changing multiple settings at the same time.
Check whether another user in the same org has the same problem.
Test a different network or device if your organization’s security policy allows it.
If your company uses SSO, VPN, proxy, firewall filtering, or a managed browser, check whether that layer is failing.
Capture the exact error text, time, URL, affected user, org, and action that failed.
These checks do not prove that Salesforce is healthy; they help separate a broad platform event from a path-specific access problem. Avoid deleting browser data, changing authentication settings, or disabling security controls as a first reaction. Those actions can create a second problem and make the original failure harder to diagnose.
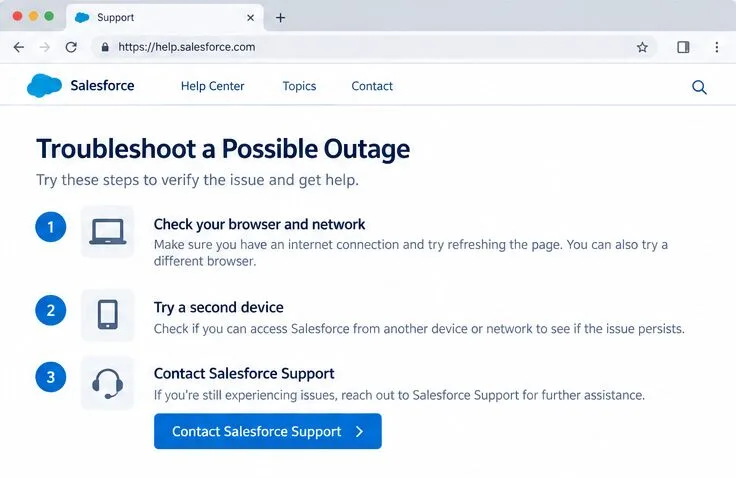
Step 4 — If Trust Status is clear, compare browser, network, and device access, then contact Salesforce Support with evidence if the problem persists.
Use error codes as clues, not as outage proof
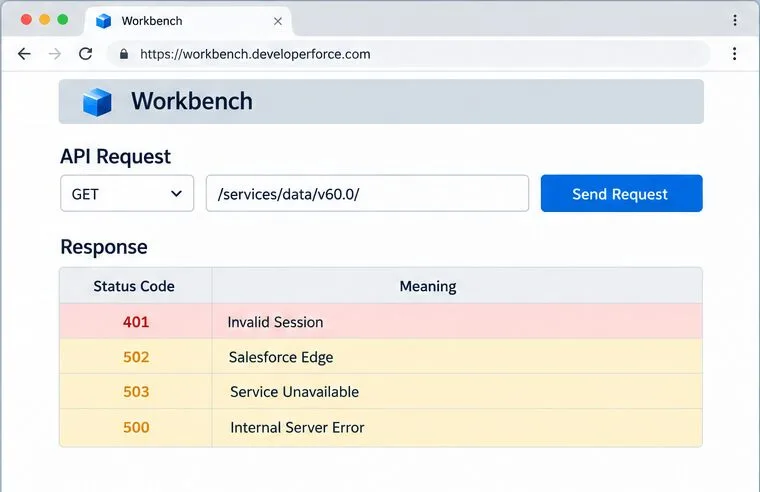
Salesforce’s developer documentation gives useful context for common API responses:
Response
Possible interpretation
500
An internal error occurred within the Lightning Platform.
502
Salesforce Edge could not communicate successfully with the Salesforce instance.
503
The server is unavailable; Salesforce notes that maintenance, overload, or request limits can be involved depending on the context.
An error code is only one clue. A 500 or 503 from one API call could result from the request, authentication, permissions, rate limits, or a service problem. Compare the error with Trust Status and test a normal browser action before labeling the event global.
When should you contact Salesforce Support?
If a core Salesforce issue has lasted more than 10 minutes and is not reflected on the Trust site, Salesforce’s help documentation says to contact Salesforce Support. Use the official Salesforce Support guidance to identify the channel available under your Success Plan.
Include the org name or instance, approximate start time with time zone, affected users, browser or API details, exact error text, incident number if one exists, and the local checks already completed. That gives Support a reproducible starting point and avoids a vague “Salesforce is down” report.
How to verify that Salesforce has recovered
Do not treat a single successful page load as full recovery. Use a short, safe validation:
Confirm that your instance status has returned to Available or that Salesforce has posted a resolution update.
Sign in and load a normal list view or dashboard.
Open a non-sensitive record and verify that related information loads.
Test the business action that originally failed, using a safe test record only if your team’s process permits it.
Check important integrations, queued jobs, and delayed notifications before declaring the incident fully resolved.
For future incidents, Salesforce provides subscription options for Trust notifications. The official notification guidance explains how to subscribe to updates for the instances or services you follow.
Final checklist
Open Salesforce Trust Status.
Check the broad product or service overview.
Search your My Domain prefix or identify the instance in Company Information.
Read the instance status, event number, scope, timestamp, and maintenance details.
Compare with another user, browser, network, or device when safe.
Contact Salesforce Support if the core issue persists beyond 10 minutes without a matching status notice.
Re-test the original workflow after the status changes and check integrations for delayed work.
Bottom line
The reliable way to check for a Salesforce global outage is to compare the Salesforce Trust Status overview with the status of your own instance. A broad incident plus matching instance-level disruption is strong evidence of a Salesforce-side event. A green Trust page means you should investigate browser, network, SSO, permissions, or org-specific causes before concluding that Salesforce is globally down. Because live status changes, record the time of every check and rely on the latest official update.