Home
» Technology
»
IoT and AI in Action: How Smart Cities Are Cutting Urban Carbon Footprints
IoT and AI in Action: How Smart Cities Are Cutting Urban Carbon Footprints
The most important point is simple: smart cities reduce carbon when connected sensors do more than collect data. The useful pattern is a closed loop: Internet of Things (IoT) devices measure what is happening, software analyzes the data, and automated controls or city operators change a physical system that uses energy or fuel. That can mean reducing unnecessary cooling, retiming traffic signals, dimming streetlights when streets are empty, shifting electricity demand, or routing service vehicles more efficiently.
That distinction matters because a city can install thousands of sensors and still achieve little climate benefit if the data never changes how infrastructure operates. The strongest projects start with a measurable emissions problem, connect the data to an operational decision, and then verify the result against a baseline.
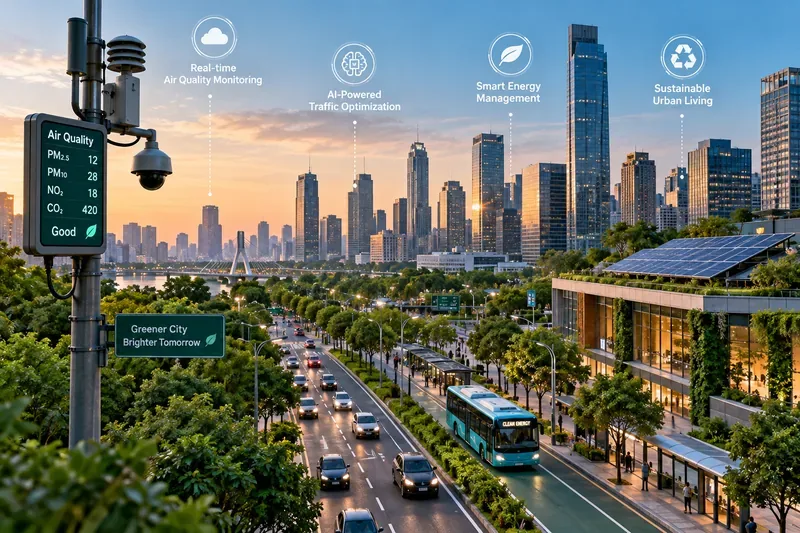
A connected urban district can combine environmental sensing, traffic optimization, public transit, rooftop solar, and smart building controls. The carbon benefit comes from how those systems change energy and fuel use, not from connectivity alone.
Why IoT and AI can matter so much in cities
Cities concentrate buildings, transport, public lighting, utilities, and other energy-intensive services in a relatively small area. The International Energy Agency (IEA) has estimated that cities generate around 70% of global carbon dioxide emissions, which is why better urban energy management can have outsized impact. The IEA's Empowering Cities for a Net Zero Future report explains that digital systems can help cities manage energy in real time and coordinate infrastructure more efficiently.
IoT and AI play different roles. IoT provides the observations: occupancy, temperature, electricity use, traffic speed, parking availability, equipment condition, light levels, or air quality. AI and advanced analytics can then detect patterns, forecast demand, flag anomalies, or recommend a better control setting. The final step is operational: a thermostat changes, a pump slows down, a traffic signal changes timing, a battery charges at a different hour, or a maintenance crew is dispatched before equipment wastes more energy.
1. Smart buildings and district energy are among the clearest carbon opportunities
Heating, cooling, ventilation, and lighting are good targets because they consume large amounts of energy and are often operated using fixed schedules. Occupancy sensors, smart meters, equipment telemetry, and weather data can show what a building actually needs instead of assuming every space needs the same service all day.
The IEA's 2025 Energy and AI analysis gives a useful scale for the opportunity: optimized heating, ventilation, and air-conditioning control can save around 10% of energy consumption in buildings equipped with management systems. That is an example of technical potential, not a guarantee for every building. Savings depend on the baseline, climate, equipment condition, occupancy patterns, and how aggressively the control system is allowed to operate.
Singapore's Punggol Digital District provides a concrete current example. JTC's page, last updated July 10, 2026, says the district has more than 20,000 sensors collecting real-time information on building performance, occupancy, environmental conditions, and energy use. According to JTC, AI and machine-learning algorithms can use those streams to achieve up to 20% energy savings. The same district combines a smart grid, rooftop solar, district cooling, and a digital twin; JTC reports a 35% reduction in annual carbon emissions for the integrated district design. The details are available in JTC's Punggol Digital District sustainability overview.
For a city or property owner considering this approach, the best fit is a portfolio with central building management, significant HVAC loads, predictable occupancy patterns, and enough submetering to establish a trustworthy baseline. A small building with already-efficient controls may have much less headroom.
2. AI-assisted traffic management can reduce wasted fuel—but only under the right conditions
Traffic is a natural use case because road conditions change minute by minute. Cameras, connected signals, road sensors, tolling systems, and vehicle-location data can provide the inputs for adaptive traffic control. AI can then predict congestion, improve route choice, identify incidents, or change signal timing.
The IEA's 2025 analysis says improved route choice and driving characteristics can produce efficiency gains of roughly 5% to 10% in transport applications. Again, that figure is a modeled or application-level estimate, not a universal city result.
Singapore offers a useful example of how this is being implemented rather than merely discussed. In an August 4, 2026 parliamentary reply, the Ministry of Transport said the Land Transport Authority is experimenting with ERP 2 data to dynamically optimize traffic signals through the Cooperative and Unified Smart Traffic System, or CRUISE. It is also expanding AI-powered video analytics for earlier incident detection. The official description is in the Ministry's traffic-management update.
The climate case is strongest when better traffic operations reduce idling, stop-and-go driving, unnecessary circling, or service-vehicle mileage. It becomes weaker if smoother roads encourage more car travel. The IEA specifically warns that rebound effects can erase part of AI's emissions benefit if technology shifts travelers away from public transit toward more private vehicle use.
3. Smart street lighting is a simpler, often easier-to-verify application
Street lighting is less glamorous than an urban digital twin, but it is one of the clearest examples of connected infrastructure delivering measurable energy savings. The basic architecture is straightforward: light sensors, motion detection, networked controls, and LED fixtures allow a city to provide the required illumination while reducing output when full brightness is unnecessary.
A Local Government Association case study in the United Kingdom describes a South Kesteven District Council deployment in which 12 streetlights used light sensors, air-quality sensing, video monitoring, timing, and dimming controls. The case study reports that the lights could fall from 70 watts to 5 watts at night and brighten again when motion was detected, producing a reported 56% saving in energy, cost, and carbon for the pilot. The project details are documented in the Local Government Association smart places case study.
This type of project is a strong fit when a city still has high-wattage fixtures, long operating hours, and streets where lighting demand varies substantially by time and activity. It is less compelling where efficient LEDs and modern dimming schedules are already in place.
4. Smart grids connect city demand with cleaner electricity
Carbon reduction is not only about using less electricity. Timing matters too. A building, battery, EV charger, or district cooling plant may be able to shift part of its demand away from the most constrained hours or toward periods with more renewable generation.
That is the logic behind grid-interactive efficient buildings. The U.S. Department of Energy's 2024 guide to grid-interactive efficient building technologies describes demand flexibility as a way to reduce energy waste, balance peak loads, and better integrate variable generation. At city scale, connected buildings can become controllable resources rather than passive consumers.
Singapore's Open Digital Platform illustrates the district version of this idea. GovTech says the platform integrates real-time data from multiple systems and can automatically switch off devices that are no longer needed. Its May 15, 2026 product page states a target of 30% lower energy consumption for the platform's Punggol Digital District use case. See the official GovTech Open Digital Platform page for the current description.
5. Waste, water, and maintenance systems can cut indirect urban emissions
Not every useful smart-city application needs sophisticated generative AI. Fill-level sensors in public bins can reduce unnecessary collection trips. Smart water meters can reveal leaks earlier. Predictive maintenance can detect a failing pump, chiller, or motor before it wastes energy or causes a larger outage. Video or environmental sensors can help a city target inspections instead of sending crews on fixed schedules.
The carbon pathway is usually indirect: fewer truck miles, less pumping, less material waste, or more efficient equipment. That means the measurement plan should track the physical outcome, not simply the number of connected devices. A city should ask, for example, how many vehicle miles were avoided, how many kilowatt-hours were saved, or how much leakage was prevented.
Smart meters, prices, renewable output, battery state
Shift or reduce loads automatically
Lower peak demand and better renewable use
Districts with flexible loads and modern controls
Waste and municipal operations
Bin fill levels, fleet location, asset condition
Route and maintenance optimization
Fewer truck miles and equipment losses
Routes with frequent unnecessary service
What separates a real carbon project from a smart-city demonstration
Start with a carbon baseline, not a technology list
A credible project defines energy or fuel use before deployment, then converts the change into carbon using a documented emissions factor. Useful metrics include kWh per square foot, fuel per vehicle-mile, cooling energy per ton-hour, or electricity per lighting-hour. Counting sensors, dashboards, or API calls does not demonstrate a climate benefit.
Connect analytics to an action
A dashboard that tells a facilities team that a building is using too much energy is helpful, but a system that can safely adjust a setpoint, schedule a repair, or switch off an unused zone creates a much shorter path to savings. The more manual handoffs a system requires, the more likely useful information will sit unused.
Measure service quality at the same time
Energy reductions are not successful if they make buildings uncomfortable, streets unsafe, or buses unreliable. Good programs track both carbon and service outcomes: comfort complaints, travel time, lighting levels, equipment uptime, water pressure, or missed waste collections.
Account for the digital footprint
AI itself consumes electricity. The IEA's 2025 report estimates that data centers were responsible for about 180 million metric tons of indirect CO2 emissions from electricity consumption in 2024, around 0.5% of global fuel-combustion emissions. That does not mean cities should avoid AI, but it does mean computation should be proportionate to the problem. A simple control algorithm may be better than a large model if it produces the same operational result.
Watch for rebound effects
Efficiency can sometimes make a service cheaper or easier to use, which can increase demand. Smoother traffic may attract more driving; cheaper cooling may lead to lower thermostat settings; easier parking may encourage more car trips. The IEA explicitly notes that these rebound effects can reduce or reverse some emissions savings. Technology therefore works best when paired with transport, land-use, building, and clean-energy policy.
How to tell whether this approach is right for your city or organization
IoT and AI are good candidates when four conditions are present: the system consumes meaningful energy or fuel, operating conditions vary over time, data can describe that variation, and someone—or an automated controller—can act on the information. If one of those pieces is missing, the business case weakens quickly.
Good candidate: a district cooling network whose load changes with occupancy and weather.
Good candidate: streetlights that run at full output during long periods with little activity.
Good candidate: a congested corridor where signal timing is static despite large changes in traffic flow.
Weak candidate: a sensor deployment with no defined operational response.
Weak candidate: an AI dashboard that cannot access reliable historical data or influence equipment settings.
Weak candidate: a project whose success metric is device count rather than energy, fuel, or CO2 reduction.
A practical test for whether the carbon claim is credible
Before calling a project successful, ask six questions. Was there a pre-project baseline? Were weather, occupancy, traffic volume, or other major variables normalized? Is the emissions factor documented? Can the city show the operational change that caused the savings? Were the electricity use of the digital system and any added equipment included when material? And are the results measured over enough time to avoid mistaking a short-term anomaly for a durable improvement?
If those answers are clear, IoT and AI can be powerful tools for urban decarbonization. If they are not, the city may have built a more connected system without proving that it is a lower-carbon one.
The bottom line
The strongest smart-city climate projects are not defined by how advanced the technology sounds. They are defined by whether data changes a high-emissions physical system in a measurable way. Smart building controls, district energy optimization, adaptive traffic management, connected lighting, flexible grids, and more efficient municipal operations can all reduce urban carbon footprints when the sensing, analytics, control, and measurement layers work together.
The current evidence also supports a cautious conclusion: AI is an accelerator, not a substitute for clean electricity, public transit, efficient buildings, compact urban design, or sound climate policy. The IEA's own 2025 assessment emphasizes that widespread AI adoption could unlock substantial emissions reductions, but only if cities overcome data, infrastructure, skills, regulatory, and rebound-effect barriers. That is the right standard for evaluating any smart-city claim: not whether the system is intelligent, but whether the city can prove it uses less carbon while delivering the same or better service.