How to fix #SPILL! error in Microsoft Excel
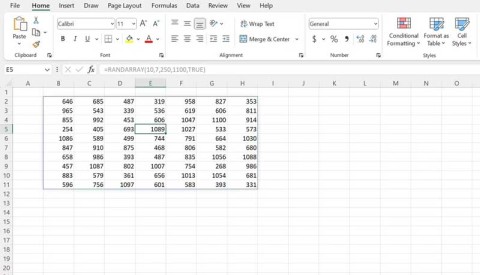
The #SPILL! error in Excel is quite common and it is quite simple to fix. Here is how to fix the #SPILL! error easily in Excel.
Data can be overwhelming, but Excel's CORREL function helps you cut through the noise. Calculating the correlation coefficient is the secret weapon for uncovering hidden trends and making smarter decisions.
What is the CORREL function in Excel?
CORREL is a statistical function in Excel that measures the relationship between two data sets. It calculates the correlation coefficient - a value between -1 and 1 that indicates the degree of linear relationship between two variables. Here is the syntax for the CORREL function in Excel:
=CORREL(array1, array2)Array1 and array2 are the two data ranges you want to analyze.
A correlation coefficient of 1 means a perfect positive correlation, while -1 means a perfect negative correlation. A value of 0 indicates no linear relationship. In this way, CORREL helps you quantify the strength and direction of these relationships in your data.
How to use the CORREL function in Excel
Now that you understand what the CORREL function does and how to prepare your data, let's go through an example to see how the CORREL function works.
Let's say you're a sales manager analyzing data from the previous year. You have three data sets: Monthly sales, TV ad spend, and radio ad spend, each with 200 data points.
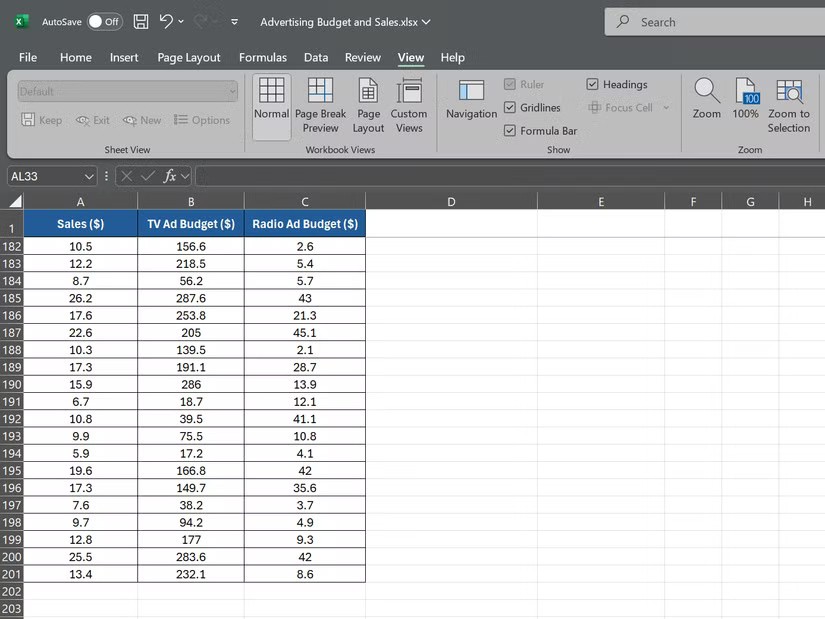
To calculate the correlation between sales revenue and TV ad spend, select an empty cell and enter:
=CORREL(A2:A201, B2:B201)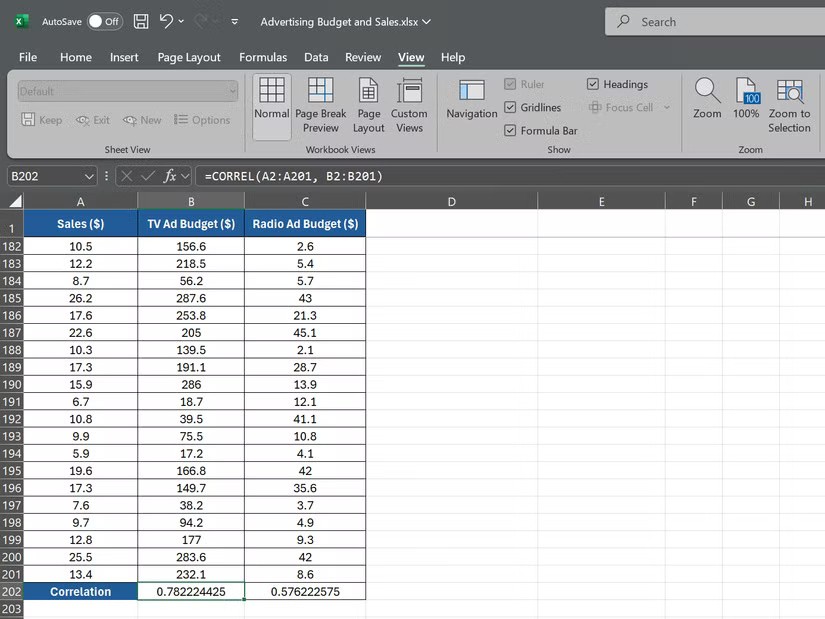
This formula tells Excel to calculate the correlation between the sales revenue data in A2:A201 and the TV ad spending data in B2:B201 . Next, to calculate the correlation between sales revenue and radio ad spending, use the following formula:
=CORREL(A2:A201, C2:C201)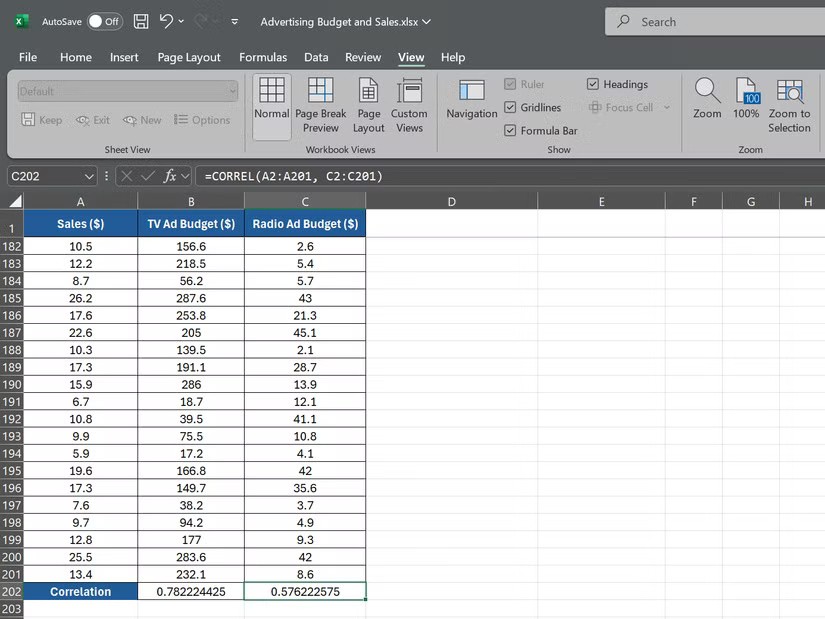
This formula will give you the correlation coefficient between the sales revenue data in A2:A201 and the radio ad spend in C2:C201.
Suppose the first formula returns a correlation coefficient of 0.78, indicating a strong positive correlation between TV ad spending and sales. The second formula returns a correlation coefficient of 0.576, indicating a weaker positive correlation between radio ad spending and sales.
Visualize correlation with scatter plots
While the CORREL function will give you a numerical value for the correlation coefficient, sometimes a visual representation can be more impactful. Create a scatter plot to visualize the relationship between variables.
Again, consider the previous example of a sales manager analyzing data from last year with 3 data sets: TV Advertising Budget ($), Radio Advertising Budget ($), and Sales ($). To create a scatter plot for this example:
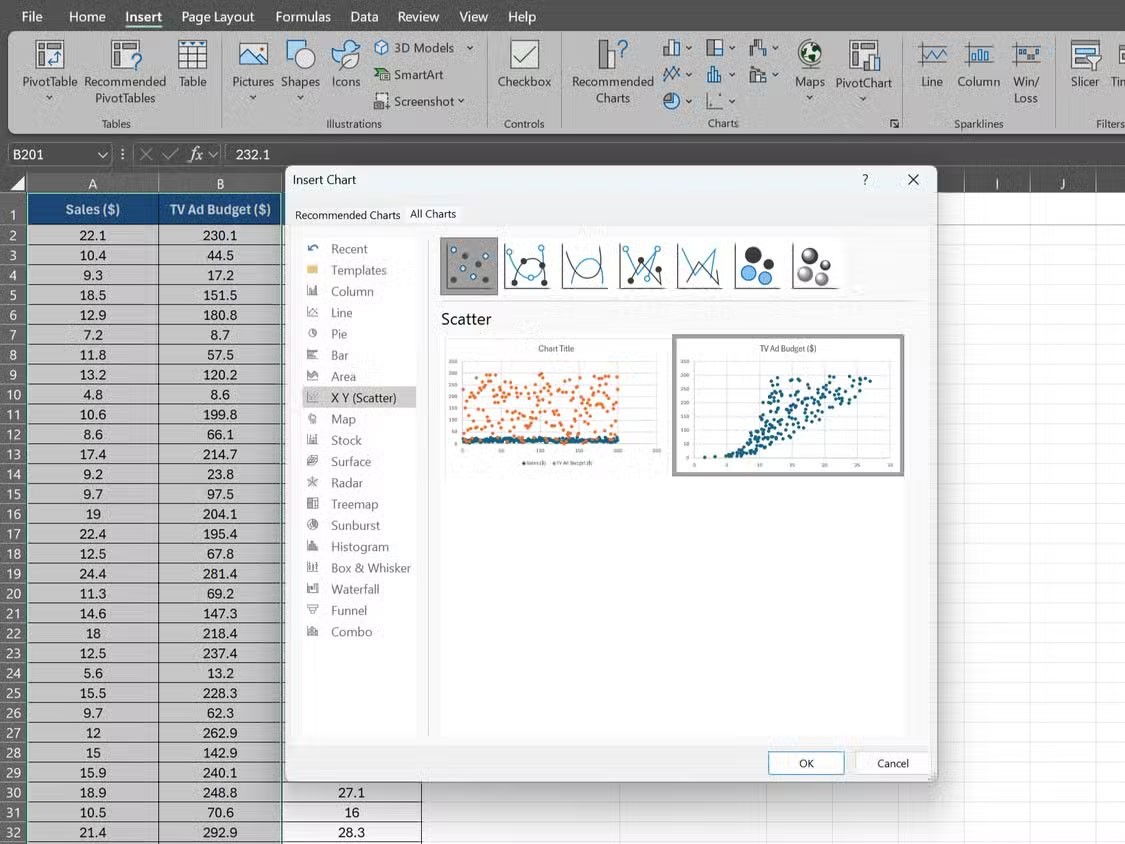
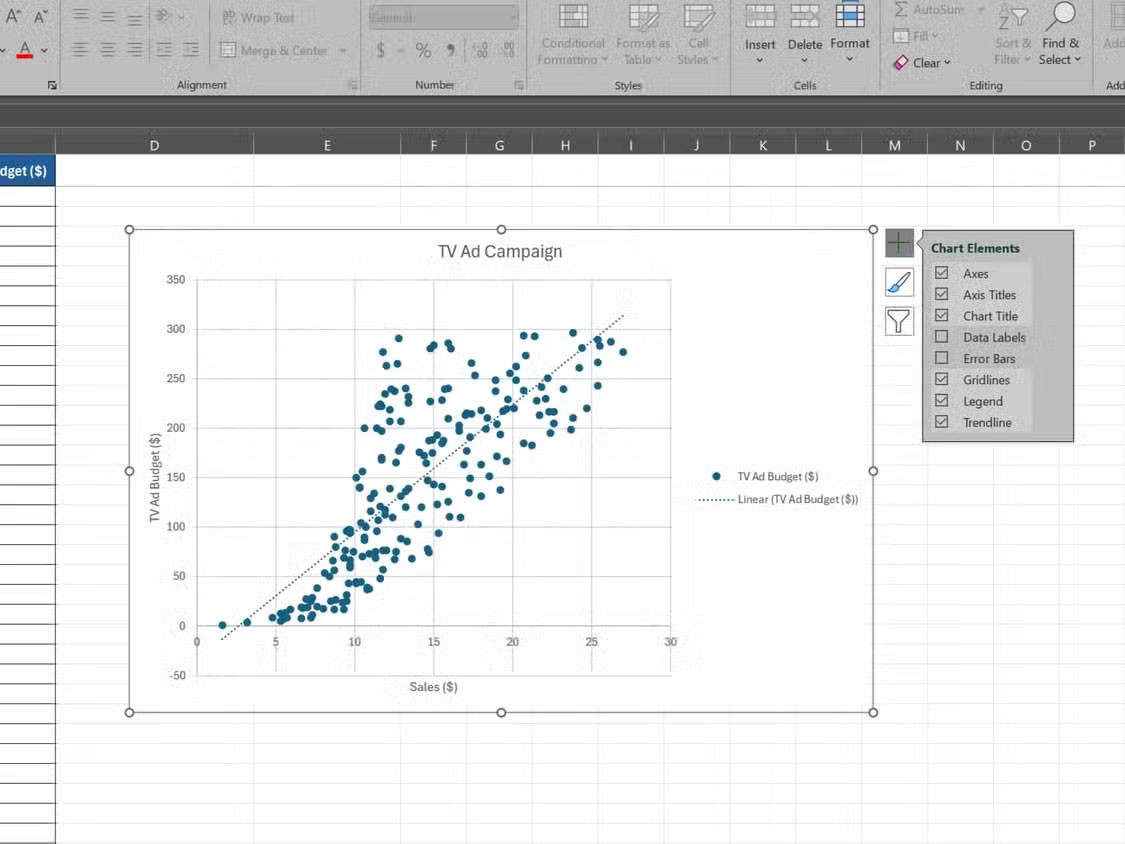
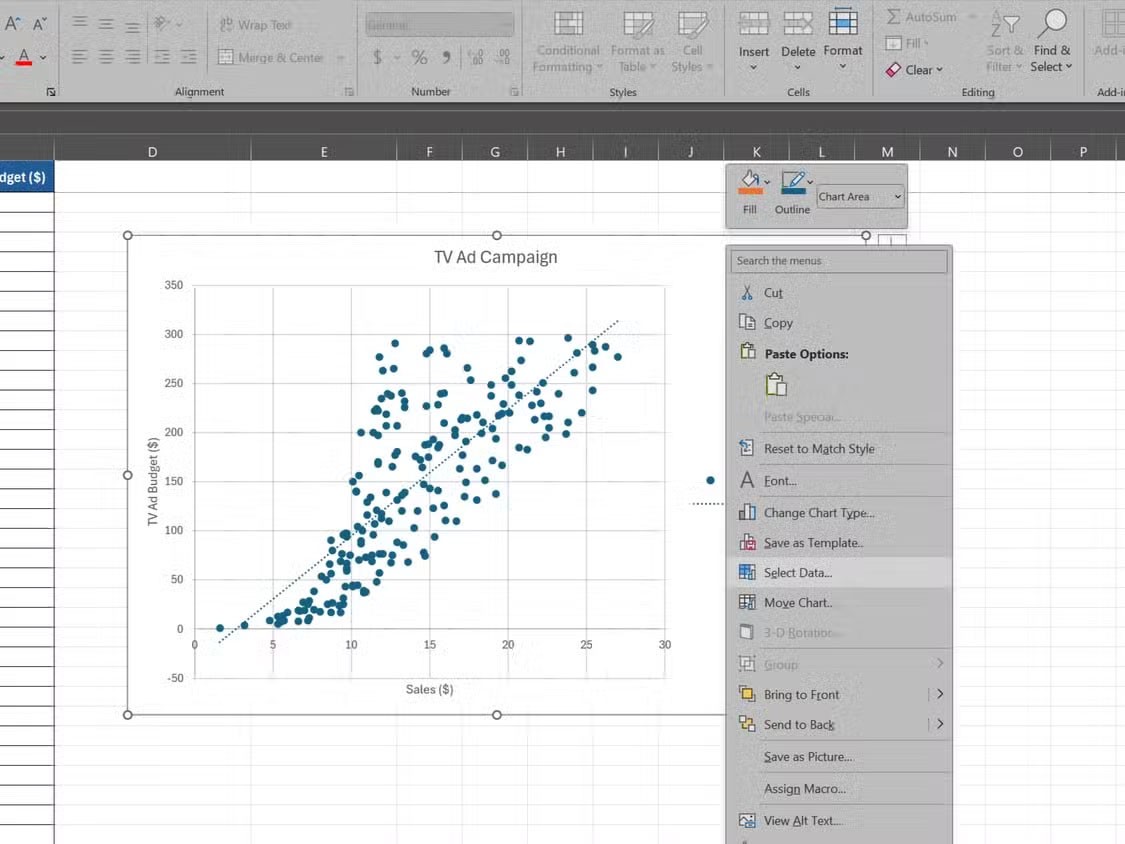
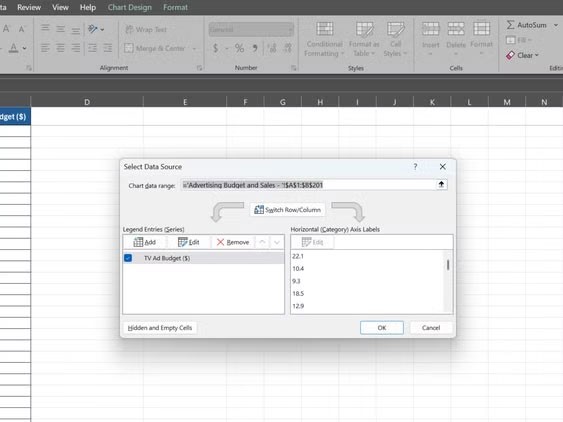
Your scatter chart will show two series: One series for the relationship between TV ad budget and sales, and another series for the relationship between radio ad budget and sales. This allows you to visually compare the correlations and determine which advertising medium has a more significant impact on sales.
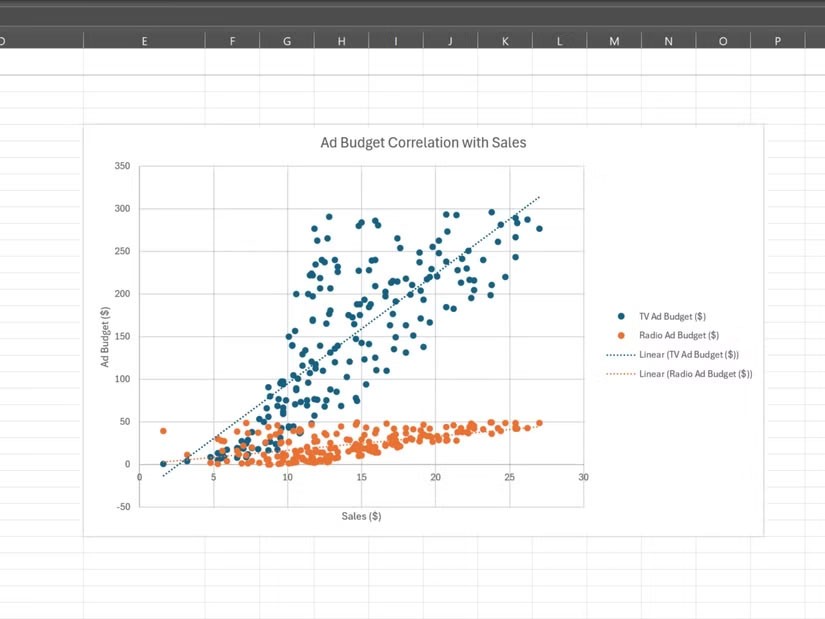
Scatter charts make it easy to spot outliers, clusters, and trends in your data. Combining a scatter chart with the CORREL function gives you a quick overview of your data, saving you a lot of work in Excel.
Combining the CORREL function with other Excel tools
The CORREL function is a powerful tool, but when combined with other Excel features, it becomes even more powerful. Two key tools that can enhance your correlation analysis are PivotTables and the XLMiner Analysis ToolPak.
PivotTables in Excel allow you to quickly summarize and analyze large data sets. Using PivotTables , you can easily calculate correlations between variables and detect trends across multiple dimensions.
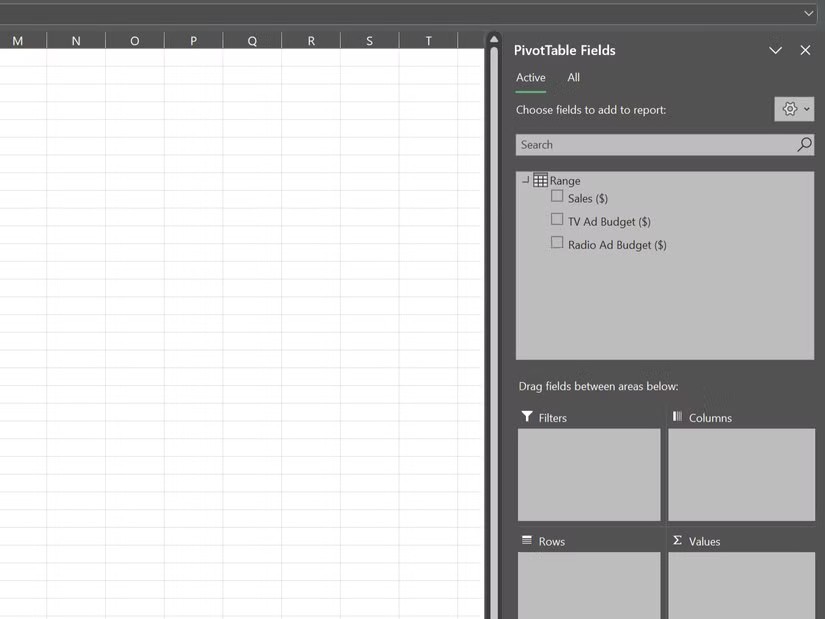
For example, suppose you have sales data broken down by region and product category; you can use a PivotTable to correlate sales and various factors such as price, advertising spend, or customer demographics for each combination of region and category.
XLMiner Analysis ToolPak is an add-in that provides advanced statistical functions, including correlation. While the CORREL function calculates the correlation between two variables, the Correlation tool in XLMiner Analysis ToolPak can calculate correlation for an entire data set in one go.
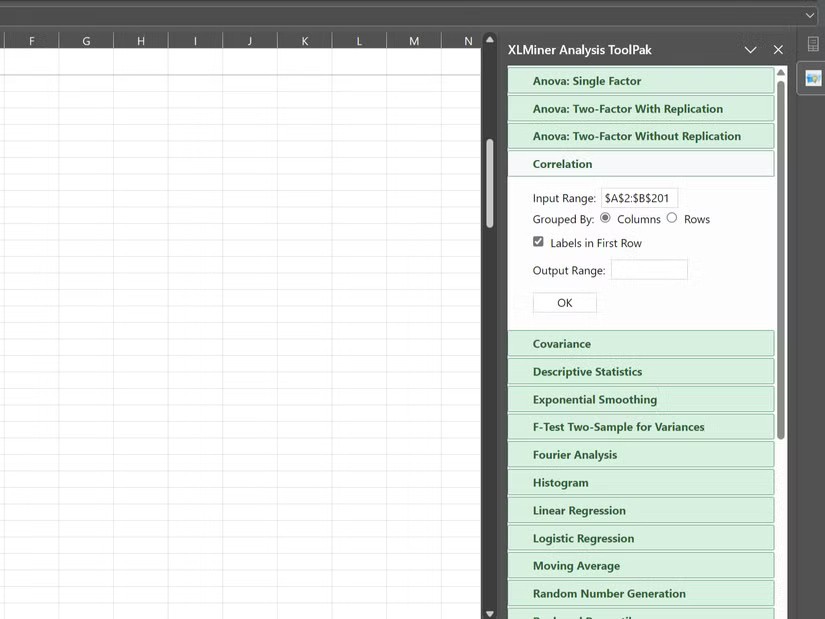
The CORREL function is a powerful tool for analyzing relationships in data, helping you gain deeper insights. However, if you want to analyze your data over time, the TREND function in Excel is another great tool to explore.
The #SPILL! error in Excel is quite common and it is quite simple to fix. Here is how to fix the #SPILL! error easily in Excel.
If you regularly work with data sets in Excel, you know how important it is to be able to quickly find the information you need.
The IF statement is a common logical function in Excel. The SWITCH statement is less well known, but you can use it instead of the IF statement in some situations.
On the surface, Excel Checkboxes seem like a very simple feature - which is probably why they are often overlooked.
Many people have tried many project management tools, but still come back to Excel for project management. While it may not be perfect for everyone, it is a simple, yet effective solution that you already know how to use.
If you can master the formulas, shortcut keys on Excel will be much faster and more convenient. Let's join WebTech360 to collect for yourself the invaluable Excel shortcut keys in the summary below.
The sum function when filtering data is very important for Microsoft Excel users. This article will summarize for you how to filter and calculate sum in Excel using Subtotal.
Airtable lets you create and share relational databases easily. Export your Airtable data to Google Sheets or Excel to enjoy the benefits of advanced charts and data visualization.
Curious about how ChatGPT can enhance your Excel experience? Here are some tips for using ChatGPT in Excel.
Most people use Excel solely as a tool for organizing data, but its versatility extends far beyond spreadsheets.
If you don't know how to create a family tree from scratch, these Microsoft Word and Excel templates can help you.
For a while, Google Sheets lured people away from Excel. But many people came back after realizing that Google Sheets is far from beating Excel.
You can calculate and visualize trends in Excel using the TREND function. Here's how to use the TREND function in Microsoft Excel.
Regex functions change that. Now you can specify exactly what you need—complex patterns, partial matches, or extracting structured data—without the effort.
Stuck with Microsoft Teams Error Code 657Rx and 9Hehw? Discover proven, step-by-step solutions to fix these frustrating errors quickly. Restore smooth video calls and chats today—no tech expertise needed!
Tired of the frustrating Microsoft Teams "For Business" Error blocking your meetings? Get proven, step-by-step fixes to resolve it fast and boost productivity. Latest solutions inside!
Struggling with Microsoft Teams Error AADSTS50011? Discover the exact Redirect URI fix for seamless authentication. Step-by-step guide with screenshots to resolve it fast—no more login headaches!
Frustrated with Microsoft Teams Breakout Rooms not creating? Discover proven fixes for "Breakout Rooms Not Erstellen" errors. Step-by-step guide ensures smooth meetings every time.
Stuck with Microsoft Teams "Error T" today? Get proven, step-by-step troubleshooting for Microsoft Teams "Error T" with quick fixes, causes, and solutions to get back to seamless collaboration. Works on desktop, web, and mobile!
Tired of Microsoft Teams "On iPhone" App Error crashing your meetings? Discover proven fixes for sign-in failures, crashes, and glitches on the latest iOS. Step-by-step guide with quick wins!
Tired of the Microsoft Teams Web Client "Disabled" Error blocking your meetings? Follow our proven step-by-step fixes to solve Microsoft Teams Web Client Disabled Error fast – no IT help needed!
Discover how to check your Microsoft Teams version using PowerShell in seconds. Step-by-step guide for IT pros, admins, and everyday users to verify updates, troubleshoot issues, and stay ahead. Accurate, fast, and foolproof methods revealed!
Struggling with Microsoft Teams Guest Access Not Working? Discover proven fixes, from quick checks to advanced troubleshooting, to get guests collaborating seamlessly in no time.
Lost important files in Microsoft Teams? Discover the exact location of the Microsoft Teams Recycle Bin and follow our proven steps to recover deleted files quickly and easily—no tech skills required!
As you age, many of your bodys organs can weaken, but it doesnt have to be that way if you take care of yourself. Here are the most essential vitamins for women over 50.
Struggling to locate your Microsoft Teams ID or account details? This step-by-step guide shows exactly where to find your Microsoft Teams ID and account info on desktop, web, mobile, and more for seamless collaboration.
Unlock the power of Microsoft Teams transcription for meetings with this step-by-step guide. Learn how to enable transcription, prerequisites, and tips for accurate transcripts to boost productivity and accessibility. Perfect for teams in 2026.
Tired of Microsoft Teams "Unknown Error" crashing your meetings? Discover step-by-step troubleshooting fixes that work instantly. Clear cache, reset app, and more—no tech skills needed!
Not all supplements are beneficial for irritable bowel syndrome (IBS), some may even worsen your symptoms.
