Leftover Halloween Candy and Pumpkins: What to Do Next

Sort leftover Halloween candy safely, share or repurpose sealed treats, and choose food use or compost for pumpkins based on their condition.
Did you know you can use Task Manager to do more than just close unresponsive programs? If you're running low on system memory, Task Manager can help you spot and fix high memory usage pretty easily.
1. Master the Processes tab
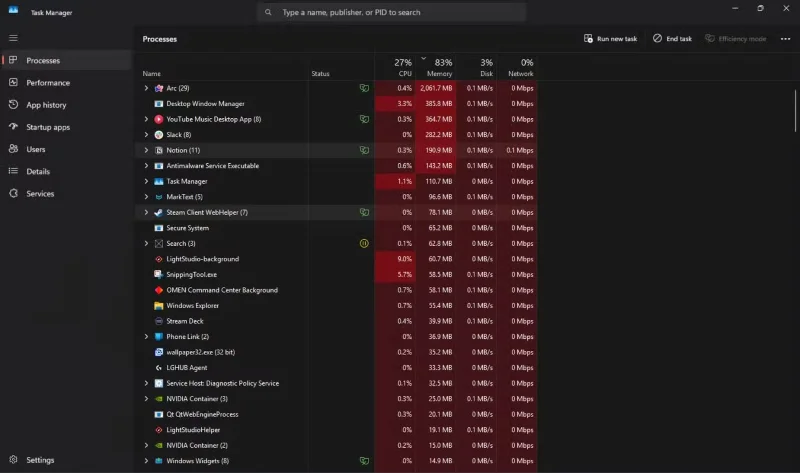
Perhaps the most important part of Task Manager for memory management is the Processes tab. This shows all running programs and Windows processes along with their CPU, memory, storage, and network bandwidth usage at a glance. This makes it easy to monitor your PC's performance.
To find the processes that are taking up the most memory, you can click on the Memory section and it will sort the processes by the amount of memory they are using. Now you can easily check how much RAM a process is using and close it immediately if needed. This is also a handy way to deal with memory leaks.
Windows runs multiple programs at once, but there is only one pool of RAM to share between those programs. Generally, when a program wants more RAM, it asks Windows to give it a block of unallocated memory.
A memory leak occurs when a program fails to return a block when it has finished using it. This results in memory that neither the program nor Windows can use, gradually depleting the memory pool as the program requests more and more memory.
The easiest way to deal with such situations is to launch Task Manager, check which process is hogging memory, and close it. You can even expand a process to examine the entire process tree and pinpoint which child process is causing the problem.
2. Check startup applications
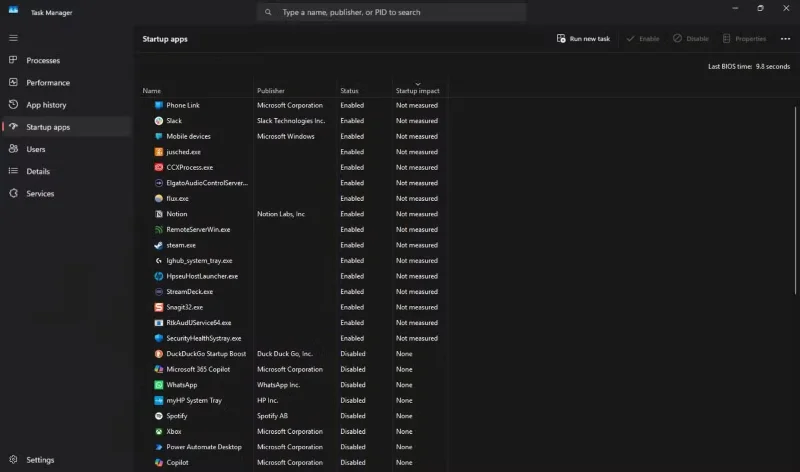
Adding applications to Windows startup is convenient, but it often means you'll launch applications that you don't need right away. This can slow down your system's boot time because more programs have to run at the beginning. It also uses more memory.
The Startup apps section in Task Manager lists all the applications that start up right after Windows starts. If your PC takes a long time to boot up, disabling some startup applications can help speed up your boot time. Also, since programs won't automatically start, you can free up more RAM for other processes.
This section also shows the impact of each startup application that has registered itself on the system. This helps you check high-impact applications at a glance and reduce BIOS time for faster boot times. The programs with the highest startup impact also tend to consume the most system memory, so you'll be solving two problems at once.
3. Monitor system services
The Services tab is a quick way to check all the system services running on your system. This includes Windows and third-party services. In case you cannot close an unresponsive program from the Processes tab , you can note down the process ID (PID) of a service and kill it using the taskkill /F /PID pid_number command in Command Prompt.
Just make sure to replace pid_number with the actual PID you see in the Services tab. If you have access issues, run Command Prompt with admin privileges to fix it.
This tab also lets you quickly start, stop, or restart problematic services. If you want to check running services in more detail, there is also a shortcut to open the Windows Services application in the upper right corner.
4. App History helps you track resource usage
As you might guess, Task Manager can do more than just monitor and fix high memory usage. If you use a lot of apps from the Microsoft Store, the App History tab can help you determine how much CPU and network power a particular UWP (Universal Windows Platform) app is using.
This tab used to only show UWP apps, but now includes regular programs you install on your Windows PC. You can use this tab to quickly see how much resources a process has used over a given time period. This is especially useful when you’re diagnosing high memory usage issues or checking your system for potential malware.
5. Progress details may be helpful
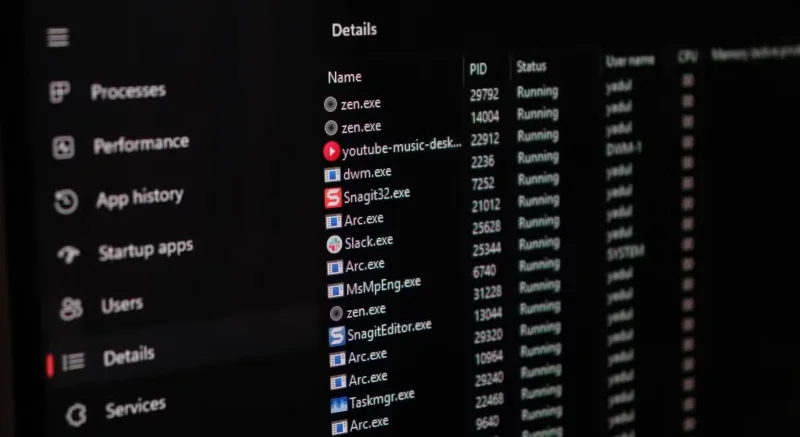
The Details tab is the most detailed tab in Task Manager. It shows the PID, status, and even which user on your PC is running the process. It also highlights CPU usage, memory usage, and provides a brief description of the process. There are a few other headings that you can enable by right-clicking on any heading and choosing the Select headings option .
Unless you’re a developer, the Processes tab should be enough to troubleshoot most memory issues. However, if you can’t figure out why your PC is consuming more memory than expected, the Details tab gives you in-depth information about every process running on your system. This makes it easy to identify and fix high memory issues without resorting to more advanced tools.
Task Manager is one of those underutilized native Windows tools. It can be used for everything from monitoring system performance to speeding up boot times. With just a few clicks, you can free up more memory and speed up your computer without having to use more advanced memory management programs, which not everyone enjoys.
Sort leftover Halloween candy safely, share or repurpose sealed treats, and choose food use or compost for pumpkins based on their condition.
Compare workplace Halloween costume choices by respect, dress code, mobility, and safety—and learn when a subtle accessory or a policy check is the better option.
Find a couples costume that fits your style, budget, and comfort level, from Addams Family classics to original inside-joke duos.
Need a last-minute high school Halloween costume? Compare 10 easy closet-based ideas by prep time, comfort, school-day practicality, and simple safety checks.
Use a simple 2026 Halloween decorating timeline for indoor décor, outdoor displays, and fresh pumpkins, with practical adjustments for weather and events.
Mix five vivid, approachable Halloween cocktails with measured recipes, simple prep tips, and an alcohol-free option for your party guests.
Find 15 office-friendly Halloween costume ideas for 2026, with practical checks for dress codes, respectful themes, comfort, and workplace safety.
Plan a fun elementary school Halloween party with easy crafts, games, inclusive treats, costume tips, and a sample 75-minute classroom schedule.
Compare realistic side hustles for 2026 by startup cost, fees, flexibility, and income control, with current tax and scam guidance from official sources.
Upgrade your home office ergonomics with current OSHA and NIOSH guidance on chair fit, monitor height, laptop setup, lighting, and movement.